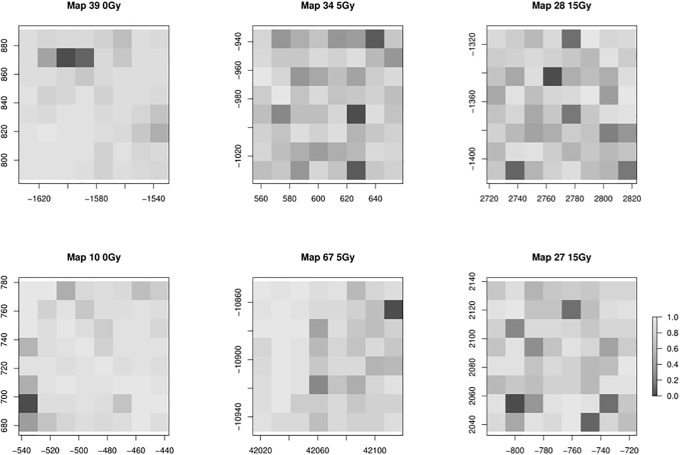
Fig 2. Example of six gray-scale Raman maps with pixel intensities equal to the scaled and discretized PC1 scores (glycogen production) obtained from running PCA on Xn×p.
Left: Map from non-radiated tumour section. Maps from irradiated mouse tumour sections are shown for mice irradiated to 5 Gy (middle) and 15 Gy (right). Pixels are 15 × 15 μm. Map numbers refer to tumour slice region of interest. A representative sample of maps has been shown.

