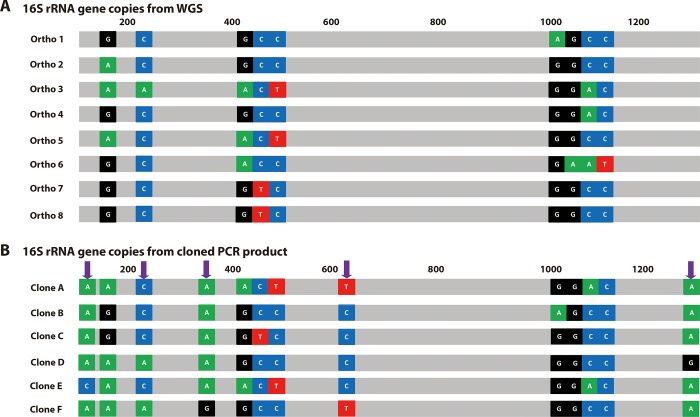
Fig 2. Representation of the number of 16S rRNA copies in GS2.
Whole genome sequencing data is shown in (A) (Ortho 1–Ortho 8), and cloned 16S rRNA genes (Clone A–Clone F) with their variations are shown in (B). Nucleotides were colored based on their color-coded based from the electropherogram result; G (black), T (red), A (green), and C (blue) and nearest locations where the variations are found in the 16S rRNA genes are placed above the schematic. The purple arrows show where the region of the Taq polymerase error produced variations.

