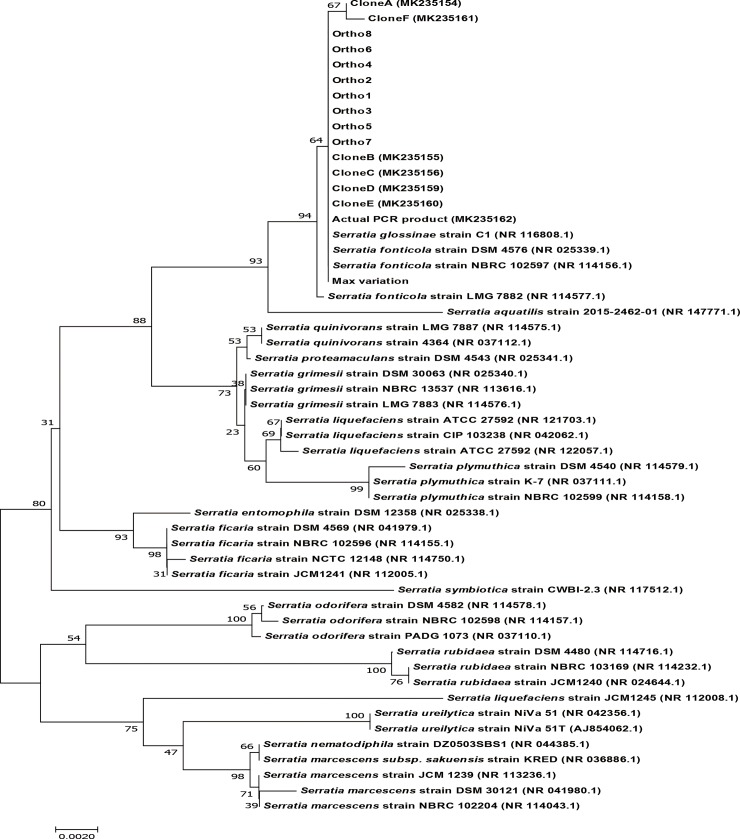
Fig 4. Phylogenetic tree of 16S rRNA genes from WGS data of S. fonticola GS2 with the cloned PCR products, actual PCR product, and the sequence that mimics the maximum variation.
Copies of the 16S rRNA genes from WGS (Ortho1-8), cloned PCR products (Clone A-F), actual PCR product, and a mimic of the sequence with the highest variation, were compared with other species from the genus Serratia using a phylogenetic tree. Bootstrap values obtained with 1000 repetitions are indicated as percentages at all branches. The scale bar represents an evolutionary distance of 0.0020. GenBank accession numbers of the different Serratia species are provided in parentheses.

