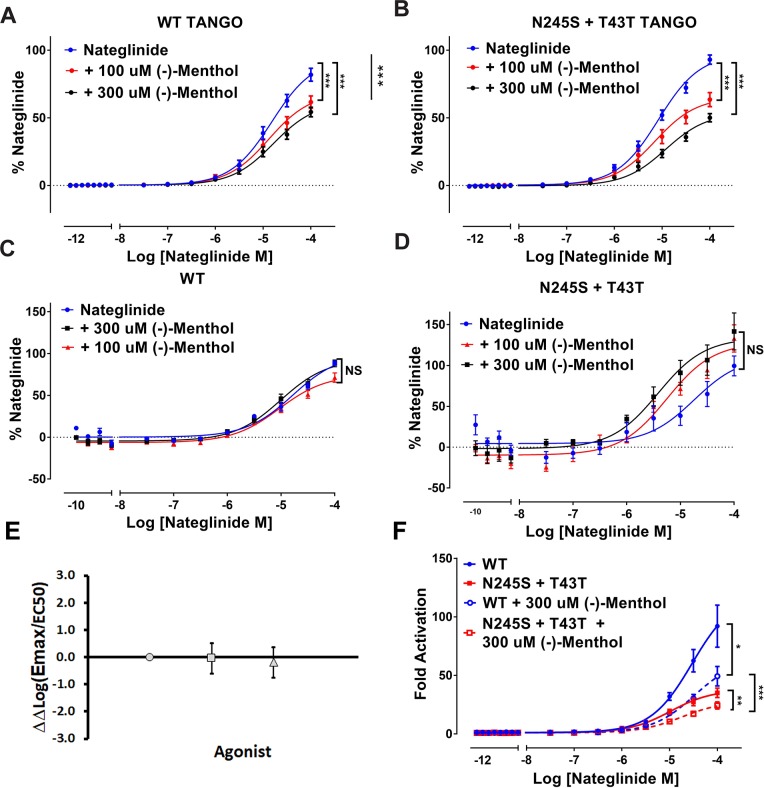
Fig 3. (-)-Menthol reduces MRGPRX4 WT and N245S+T43T arrestin signaling.
(A),(B) Average concentration response curves for Nateglinide in MRGPRX4-WT-Tango (A) or MRGPRX4-N245S+T43T-Tango (B) following 100 μM or 300 μM (-)-menthol addition, (n = 3, in triplicate, y-axis is % Nateglinide). (C),(D) Average concentration response curves for Nateglinide-induced PI hydrolysis in MRGPRX4-WT (C) or MRGPRX4- N245S+T43T (D) tetracycline inducible cells following 100 μM or 300 μM (-)-menthol addition, (n = 3, in duplicate, y-axis is % Nateglinide). (E) Plot showing the effect of agonist treatments (x-axis) Nateglinide (gray circles), Nateglinide + 100 μM (-)-menthol (gray squares) and Nateglinide + 300 μM (-)-menthol (gray triangles) between WT and N245S+T43T variant shown as ΔΔLog(Emax/EC50) values (y-axis). Y vales > 0 indicate increased effect for agonist at WT and values < 0 indicate increased effect for agonist at N+T variant. Bars depict 95% confidence intervals. (F) Average concentration response curves for fold change activation with Nateglinide in MRGPRX4-WT-Tango or MRGPRX4-N245S+T43T-Tango following 300 μM or 300 μM (-)-menthol addition, (n = 3, in quadruplicate). For all: NS = not significant, * p<0.05, ** p <0.01, and *** p<0.001 as calculated by F-test.

