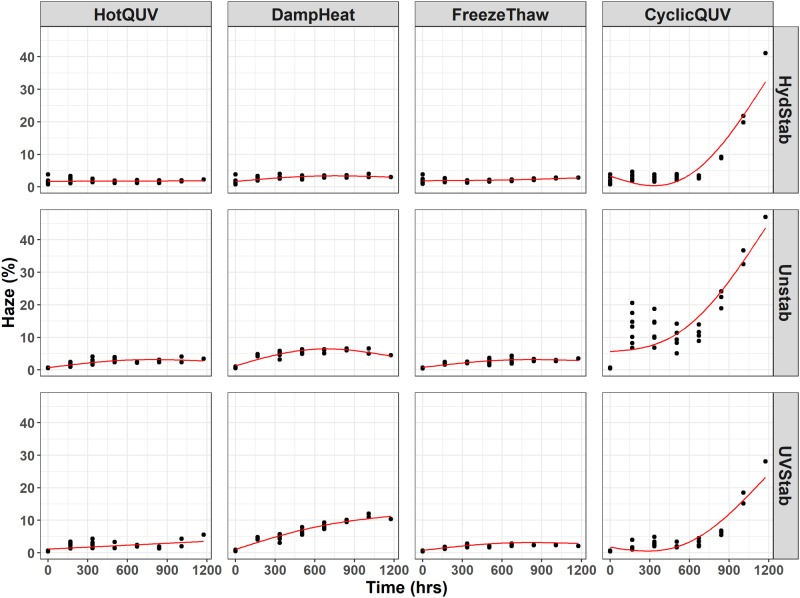
Fig 2. Cross panel figure for the change in haze (%) with exposure time.
Note that the exposures are shown as columns and PET grades are shown as rows in the figure. Each exposure step (168 hours) corresponds to one week of exposure and the total exposure time (1176 hours) of seven steps corresponds to seven weeks of exposure. Regression lines are obtained through pathway equations from the netSEM analysis and represent the best fit for each relationship based on adjusted R2 values.

