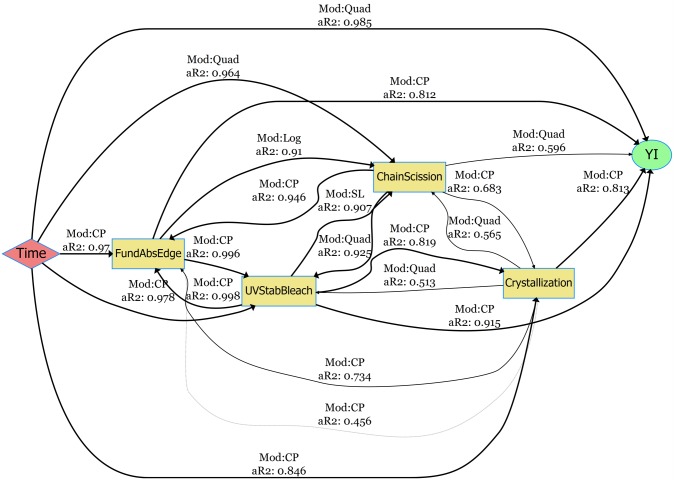
Fig 9. netSEM pathway diagram for the yellowing of UV stabilized grade under the CyclicQUV exposure.
The fitting models (Mod) and the adjusted R2 values (aR2) for each relationship are given along the connection lines. The models are SL (simple linear), SQuad (simple quadratic), Quad (quadratic), Exp (exponential), Log (logarithmic), CP (change point), and nls (non-linear least squares regression).

