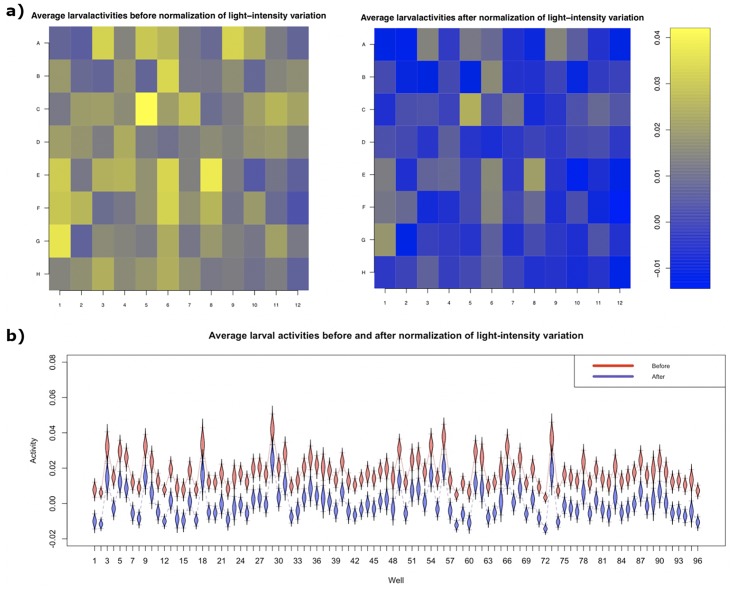
Fig 2. Normalization of larval activities due to variation of light intensity across different wells.
(a) Heatmaps showing average larval activities in each well of the 96-well plate before (left) and after (right) normalizing the light-intensity variation across the plate. These larval activities were extracted from 6-dpf TL larvae from 1 to 30s after light onset. (b) A boxplot of average larval activities before (red) and after (blue) light-intensity normalization. The whiskers of each box indicate the 95% confidence intervals.

