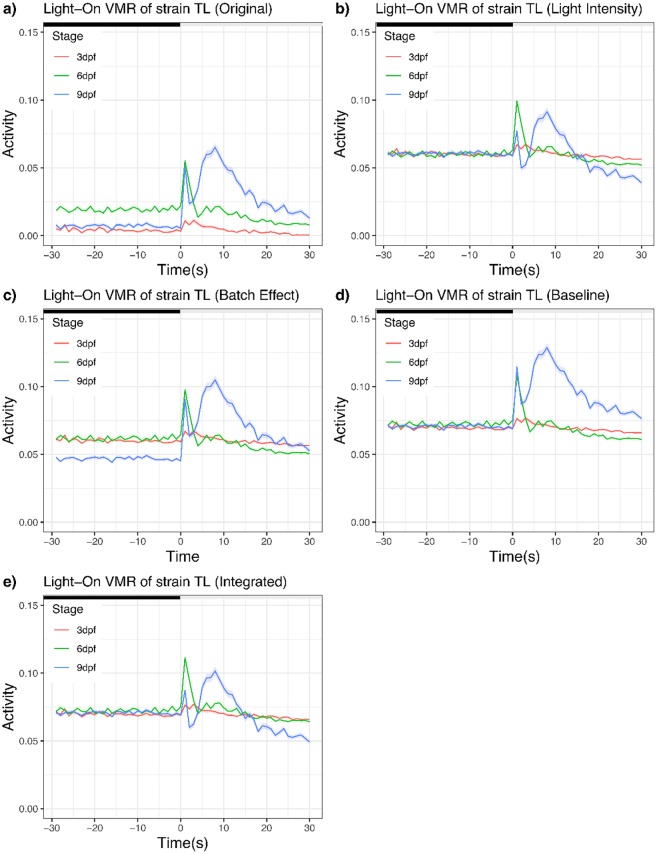
Fig 3. Light-On VMR of strain TL normalized by different approaches.
(a) Original data without any normalization. (b) Light-intensity normalization. (c) Batch-effect normalization. (d) Baseline normalization. (e) Integrated normalization. In all plots, the activities of larvae at different stages were plotted from 30 seconds before light onset to 30 seconds after light onset. The solid traces show the mean activities (red trace: 3dpf; green trace: 6 dpf; and blue trace: 9 dpf), whereas the ribbons surrounding these activity traces indicate the corresponding standard error of the pointwise mean activity. The offset value μoffset for (b) to (e) was 0.06.

