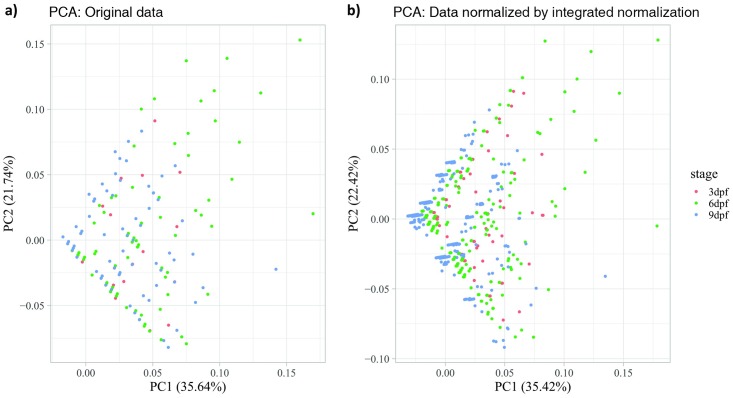
Fig 5. Two-dimensional Principal Component Analysis (2D PCA) scores plots of VMR data before and after the integrated normalization.
(a) Original data without normalization. (b) Data normalized by integrated normalization. Both plots include the activities of larvae from 2 seconds before light onset to 3 seconds after light onset at different stages: 3 dpf (red), 6 dpf (green), and 9 dpf (blue). Each dot represents the time-series activity profile of one individual larva from different stages.

