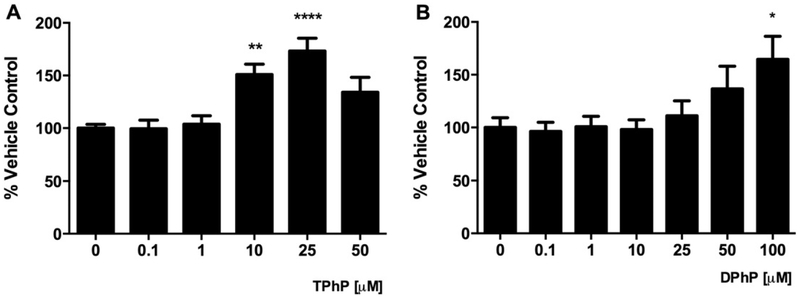
Fig. 3.
Effect of TPhP (A) and DPhP (B) on adipogenic differentiation of pre-adipocytes 3T3-L1 measured by staining neutral lipids using the oil red O assay. TPhP and DPhP were added to the weak differentiation cocktail during the whole differentiation process. Statistical analysis was performed using one-way ANOVA followed by a Dunnett’s test to compare the different dose levels of TPhP and DPhP with the respective vehicle control. Results are represented by the mean and the standard error of the mean from three experimental replicates (n = 3). Significance levels are represented with asterisk as following: (*) P < 0.05, (**) P < 0.01, (***) P < 0.001.

