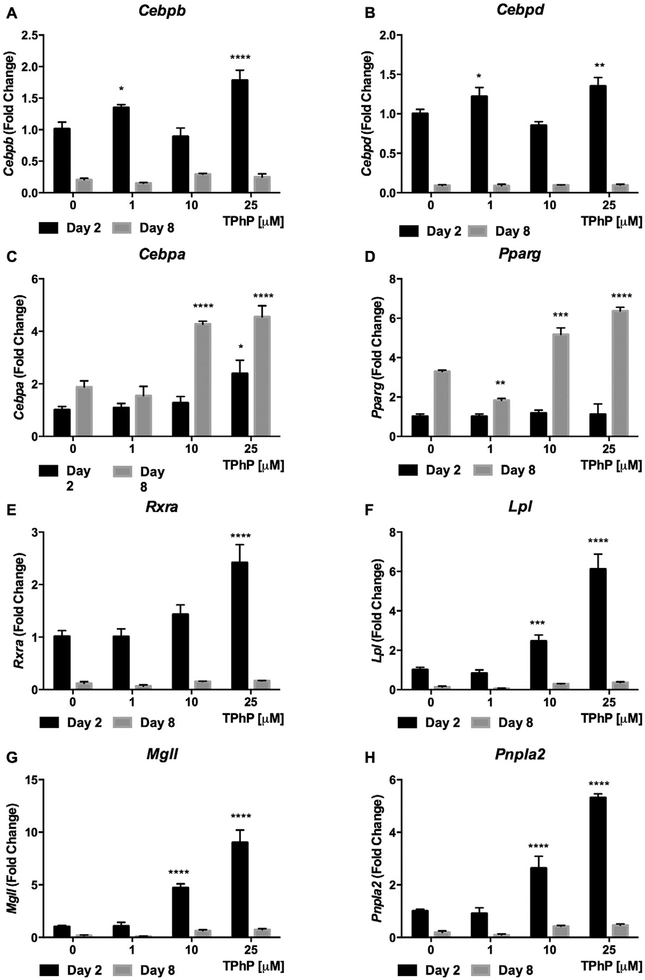
Fig. 4.
Effect of TPhP on gene expression of master regulators of adipogenic differentiation and lipolysis of 3T3-L1 cells during early and late differentiation. The cells were treated with TPhP (1, 10 and 25 μM) during the full differentiation process. The comparative Ct method (2−ΔΔCt) was used to represent the results as fold change respective to the vehicle control and using Actb as endogenous control. Statistical analysis was performed using Two-way ANOVA with Dunnett’s test to compare the different dose levels of TPhP with the respective vehicle control. Significance levels are represented with asterisk as following: (*) P < 0.05, (**) P < 0.01, (***) P < 0.001, (****) P < 0.0001.

