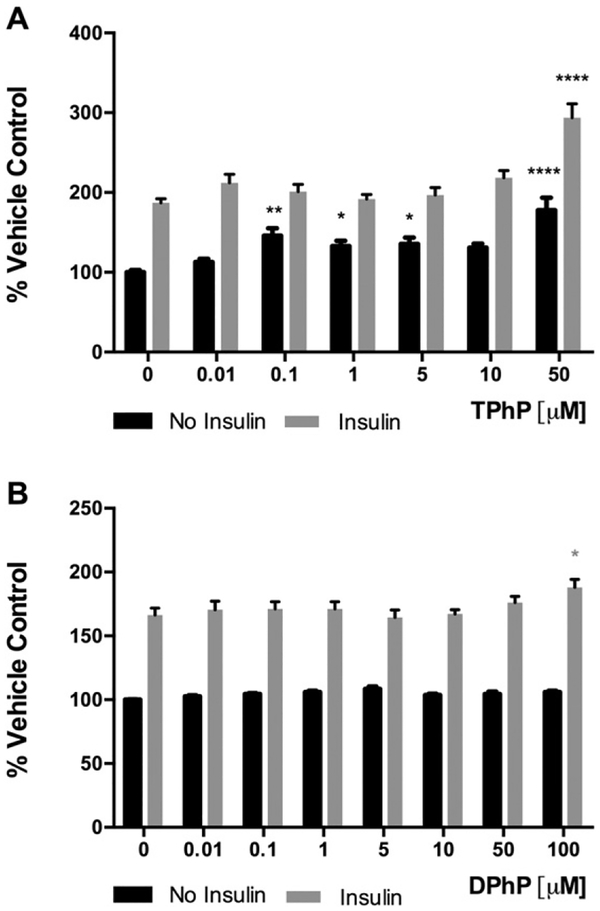
Fig. 5.
Effect of TPhP (A) and DPhP (B) on the fluorescent glucose analog 2-[N (−7-nitrobenz-2-oxa1, 3-diazol-4-yl) amino]-2-deoxy-d-glucose (2-NBDG) uptake by differentiated 3T3-L1 adipocytes in presence or absence of insulin (100 nM). Statistical analysis was performed using two-way ANOVA with Dunnett’s test to compare the different dose levels of TPhP and DPhP with the respective vehicle control. Results are represented by the mean and the standard error of the mean from at least five experimental replicates (n = 5). Pinteraction = 0.007 and 0.09 for TPhP and DPhP respectively. Significance levels are represented with asterisk as following: (*) P < 0.05, (**) P < 0.01, (***) P < 0.001, (****) P < 0.0001.

