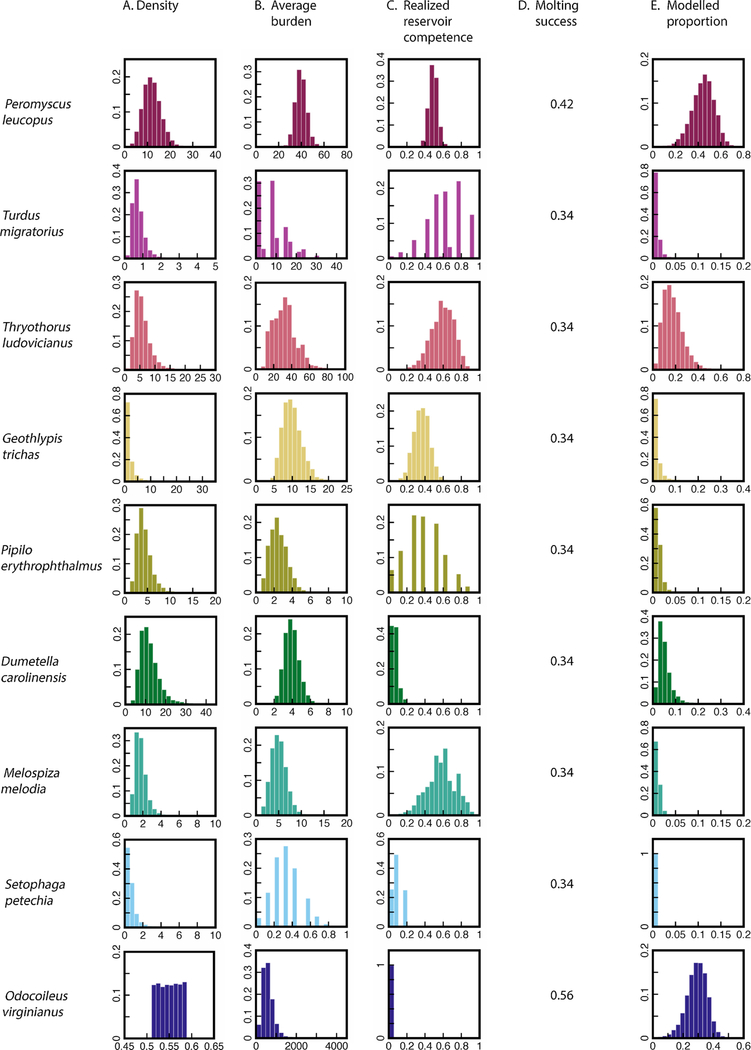
Fig. 2.
Distribution for observed and modeled parameters. Value distributions for observed parameters (Columns A, B and C), fixed values for molting success according to LoGiudice et al. (2003) (Column D) and modeled proportions of larvae on Block Island feeding on white-footed mice, seven avian hosts, and white-tailed deer in 2014 (Column E). The average larval burden on deer was not observed in this study, the distribution shown was inferred from the results of the numerical simulation.

