Figure 2.
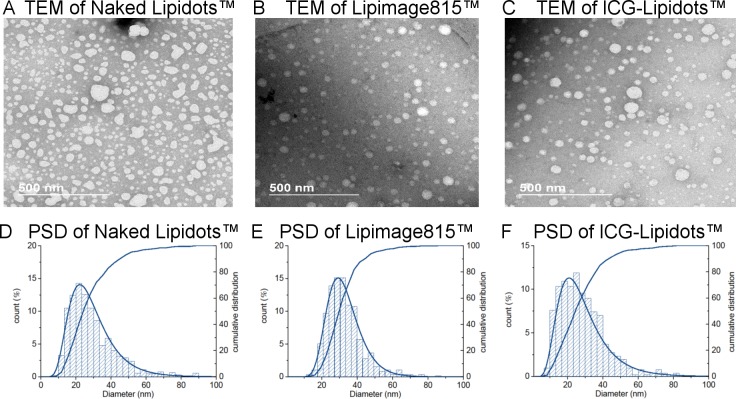
TEM images and particle size distribution of the Lipidots formulations. TEM images of (A) Naked Lipidots, (B) Lipimage815, and (C) ICG Lipidots. Calculated differential and cumulative particle size distribution (%) of the (D) the Naked Lipidots, (E) the Lipimage 815, and (F) and the ICG Lipidots.

