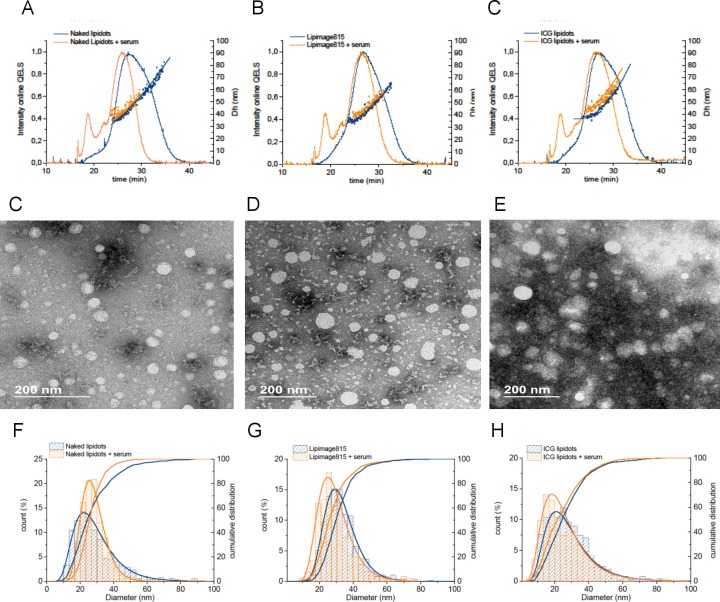
Figure 5.
Effect of NP-protein interactions by TEM and AF4-MALS-DLS. AF4-DLS elution profiles: intensity of the scattered light of the online DLS detector and the calculated hydrodynamic diameter are reported for (a) the Naked Lipidots, (b) the Lipimage 815, and (c) and the ICG Lipidots. TEM images of the (d) the Naked Lipidots, (e) the Lipimage 815, and (f) and the ICG Lipidots after incubation with serum. Calculated differential and cumulative particle size distribution (%) of the (g) the Naked Lipidots, (h) the Lipimage 815, and (i) and the ICG Lipidots. Blue curve: NPs eluted alone; Orange curve: NPs + serum.

