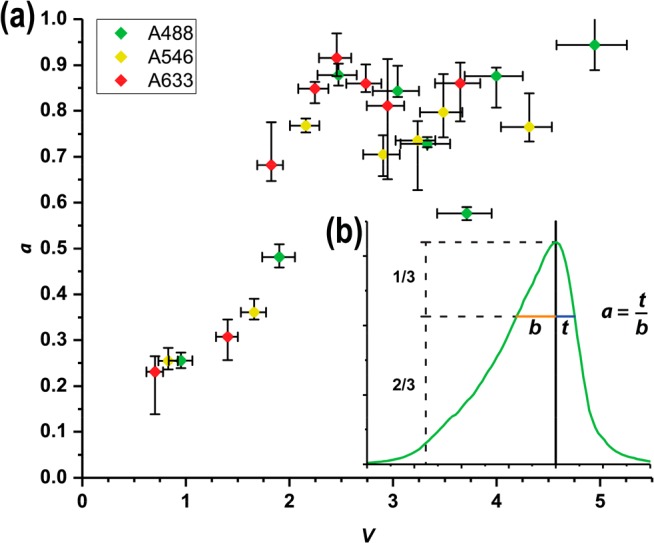
Figure 3.

(a) Measured asymmetry parameter, a,
as a function
of the normalized frequency parameter, V, for every
combination of d and λ tested (color-coded
for wavelength as indicated in the legend). V was
calculated for each data point as a weighted average over the corresponding
fluorophore’s emission spectrum, resulting in the horizontal
error bars shown. Vertical error bars represent the deviation of a within the measurements. (b) Graphic representation of
how the asymmetry parameter  is defined (see main text for details;
axes are the same as those in Figure 2d). One expects a = 1 for a perfectly
symmetric peak, a = 0 for an infinitely long, nonlightguiding
nanowire, and a ≈ 0.2 for a nonlightguiding
wire about 3.5 μm long, observed under confocal illumination.
Examples of how the parameter a is determined are
given in the Supporting Information Section 7.
