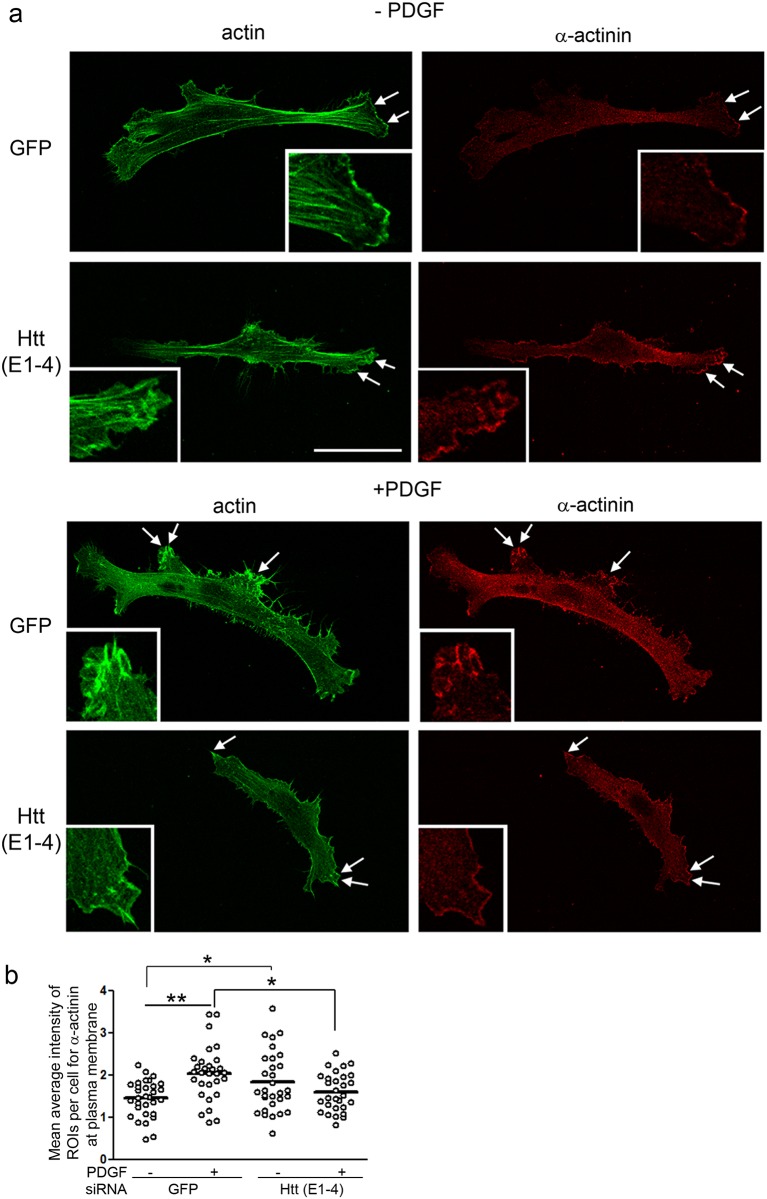
Fig 8. Reduced Huntingtin levels alter localization of α-actinin at the plasma membrane.
(a) Confocal micrographs of human fibroblasts labeled for F-actin with Alexa-Phalloidin (Green) and α-actinin (Red). Cells were treated with siRNA targeting GFP as a control or E1-4 targeting Huntingtin (Htt). Shown are representative images of cells serum-starved or cells treated for 15 minutes with 100 ng/ml PDGF. Insets show higher magnification of the regions at double arrows. Scale bar = 50 μm. (b) Graph shows mean pixel intensity (bar) for α-actinin at membrane ruffles in well spread cells Types 1–3 (see Methods). Statistics were performed by one-way ANOVA and Tukey’s HSD posthoc test, n = 30 cells, 3 coverslips per condition; *p<0.05, **p<0.001.

