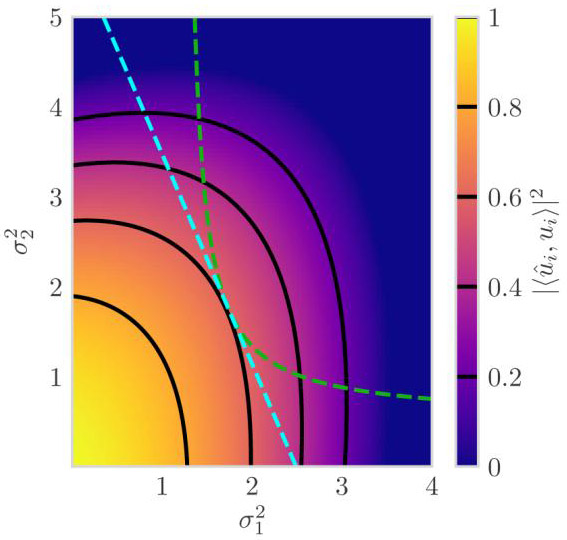
Figure 3:

Asymptotic subspace recovery (4) of the ith component as a function of noise variances and occurring in proportions p1 = 70% and p2 = 30%, where the sample-to-dimension ratio is c = 10 and the subspace amplitude is θi = 1. Contours are overlaid in black and the region where A(βi) ≤ 0 is shown as zero (the prediction of Conjecture 1). Along the dashed cyan line, the average noise variance is and the best performance occurs when . Along the dashed green curve, the average inverse noise variance is and the best performance again occurs when .
