. 2019 Feb 15;8:e41556. doi: 10.7554/eLife.41556

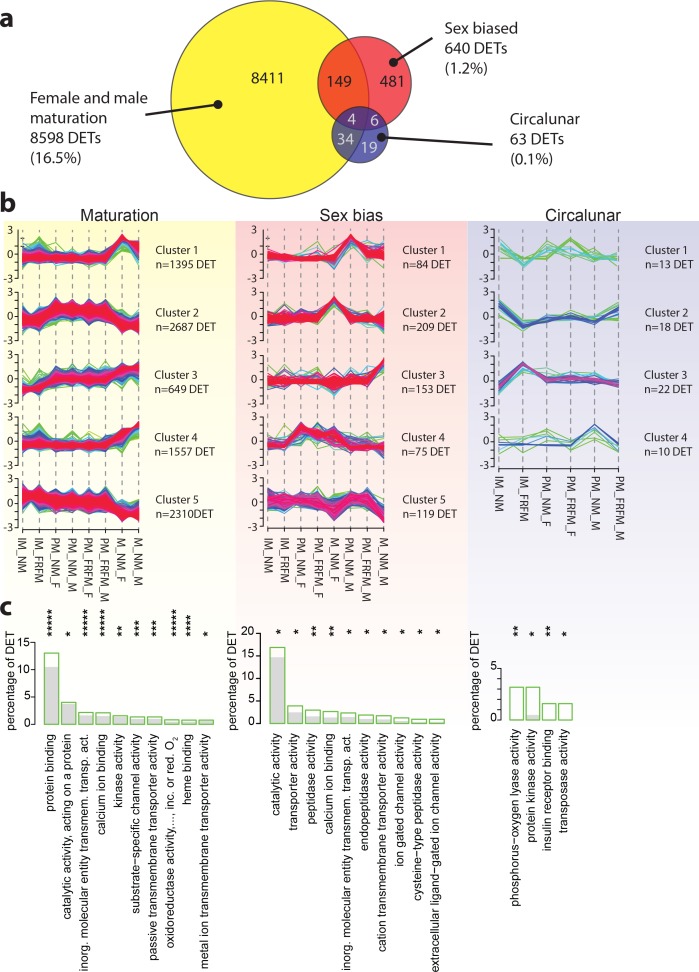
Figure 3. Maturation, sex and circalunar phase have distinct transcriptomic signatures in Platynereis heads.

(a) Venn diagram showing the overall numbers of genes identified as significantly regulated within and across the three different biological processes. Percent in brackets indicate the respective fraction compared to total number of analyzed IDs. (b) Soft clustering of differentially expressed genes using the Mfuzz algorithm. Maturation (yellow) and sexual differences (light red) yielded five clusters; circalunar phase-regulated (light blue) expression was best represented by four clusters. Compare to Figure 5b for similarity to regulated protein clusters. (c) Results from the GO-term enrichment analysis using the GOStats package on the differentially expressed genes in each comparison; the ten most abundant terms in the Molecular Function category are displayed (for more GO-results see Figure 3—figure supplement 19). Green boxes: actual percentage of differentially expressed transcripts for each term; grey bars: expected number of transcripts per category. Maturation: protein binding: GO:0005515, catalytic activity, acting on a protein: GO:0140096, inorganic molecular entity transmembrane transporter activity: GO:0015318, calcium ion binding: GO:0005509, kinase activity: GO:0016301, substrate-specific channel activity: GO:0022838, passive transmembrane transporter activity: GO:0022803, oxidoreductase activity, acting on paired donors, with incorporation or reduction of molecular oxygen: GO:0016705, heme binding: GO:0020037, metal ion transmembrane transporter activity: GO:0046873. Sex bias: catalytic activity: GO:0003824, transporter activity: GO:0005215, peptidase activity: GO:0008233, calcium ion binding: GO:0005509, inorganic molecular entity transmembrane transporter activity: GO:0015318, endopeptidase activity: GO:0004175, cation transmembrane transporter activity: GO:0008324, ion gated channel activity: GO:0022839, cysteine-type peptidase activity: GO:0008234. Circalunar phase: phosphorus-oxygen lyase activity: GO:0016849, protein kinase activity: GO:0004672, insulin receptor binding: GO:0005158, transposase activity: GO:0004803. Statistical significance was tested with a hypergeometric G-test implemented in the GOStats package. *p < 0.05, **p < 0.01, ***p < 0.001, ****p < 0.0001, *****p < 0.00001.

Figure 3—source data 1. Platynereis head reference transcriptome v5 read counts.
Table containing the raw read count data for TS_v5. This table is used as input for differential expression analysis.
DOI: 10.7554/eLife.41556.024
Figure 3—source data 2. Transcriptome: DESeq normalised read counts.
Normalised read counts of TS_v5 as calculated by the DESeq2 algorithm; used to build DET expression graphs.
DOI: 10.7554/eLife.41556.025
Figure 3—source data 3. Platynereis head reference transcriptome v5 gene universe.
Table containing the "gene universe" for the TS_v5 used as background for GO-term enrichment analysis in Figs. 3 and S3a-k.
DOI: 10.7554/eLife.41556.026
Figure 3—source data 4. Transcriptome: DESeq output tables.
File containing DESeq predicted DETs for all 14 comparision made. Each comparison is contained within a separate tab.
DOI: 10.7554/eLife.41556.027
Figure 3—source data 5. Transcriptome: EdgeR output tables.
File containing EdgeR predicted DETs for all 14 comparision made. Each comparison is contained within a separate tab.
DOI: 10.7554/eLife.41556.028
Figure 3—source data 6. Transcriptome: DESeq2-EdgeR rank sum files.
This file contains DESeq2-EdgeR rank sums for predicted DETs for all 14 comparision made plus the all maturation rank sum predictions. Each comparison is contained within a separate tab. Note that while DESeq2 calculates the log2 fold change as A/B; EdgeR calculates the log2 fold change as B/A. log2FoldChange: DESeq2; log2FC: EdgeR; padj: BH-adjusted p-value DESeq2; FDR: BH-adjusted p-value EdgeR.
DOI: 10.7554/eLife.41556.029
Figure 3—source data 7. Transcriptome: Mfuzz cluster gene IDs with cluster membership values.
This file contains the soft clustering output of RNA expression values with Mfuzz. Each comparison, maturation, sex, and lunar contains the individual transcript ID and the membership values for each cluster ranging from 0 to 1.
elife-41556-fig3-data7.xlsx (935.2KB, xlsx)
DOI: 10.7554/eLife.41556.030
Figure 3—source data 8. Transcriptome: all over- and under-represented GO-Terms from all comparisions.
Table containing the results of the GO-term analysis on transcript level. Individual GO-terms are shown with their respective p-values in each of the three comparisons made (maturation, sex, and lunar), as well as their ontolgy, i.e. Molecular Function, Biological Process, or Cellular Compartment.
DOI: 10.7554/eLife.41556.031
Figure 3—source data 9. Transcriptome: over- and under-represented GO-Terms maturation comparison.
This file contains the over- and under-representet GO-terms for the maturation comparison on transcript level. Tabs for each of the three ontologies, i.e. Molecular Function, Biological Process, and Cellular Compartment.
DOI: 10.7554/eLife.41556.032
Figure 3—source data 10. Transcriptome: over- and under-represented GO-Terms sex bias comparison.
This file contains the over- and under-representet GO-terms for the sex comparison on transcript level. Tabs for each of the three ontologies, i.e. Molecular Function, Biological Process, and Cellular Compartment.
DOI: 10.7554/eLife.41556.033
Figure 3—source data 11. Transcriptome: over- and under-represented GO-Terms circalunar comparison.
This file contains the over- and under-representet GO-terms for the lunar comparison on transcript level. Tabs for each of the three ontologies, i.e. Molecular Function, Biological Process, and Cellular Compartment.
DOI: 10.7554/eLife.41556.034
Figure 3—source data 12. Transcriptome: over-represented GO-Term unique for any of the three comparisons.
This file contains those over-represented GO-terms which are unique to a given comparison on transcript level, i.e. maturation, sex, or lunar, with p-values for each of the three comparision.
DOI: 10.7554/eLife.41556.035
Figure 3—source data 13. All transcripts significantly regulated during maturation (maturation DETs).
This file contains the IDs, mean expression values, top hit by blastX with e-value cut-off 10-4, e-value corresponding to blast hit, number of identical/ similar AA or gaps in blast alignment ("identity", "positives", "gaps") for all transcripts significantly regulated during maturation.
DOI: 10.7554/eLife.41556.036
Figure 3—source data 14. All transcripts significantly regulated during sexual differentiation (sex DETs).
This file contains the IDs, mean expression values, top hit by blastX with e-value cut-off 10-4, e-value corresponding to blast hit, number of identical/ similar AA or gaps in blast alignment ("identity", "positives", "gaps") for all transcripts significantly regulated between males and females.
DOI: 10.7554/eLife.41556.037
Figure 3—source data 15. All transcripts significantly regulated between circalunar phases (lunar DETs).
This file contains the IDs, mean expression values, top hit by blastX with e-value cut-off 10-4, e-value corresponding to blast hit, number of identical/ similar AA or gaps in blast alignment ("identity", "positives", "gaps") for all transcripts significantly regulated between circalunar phases.
DOI: 10.7554/eLife.41556.038

Figure 3.

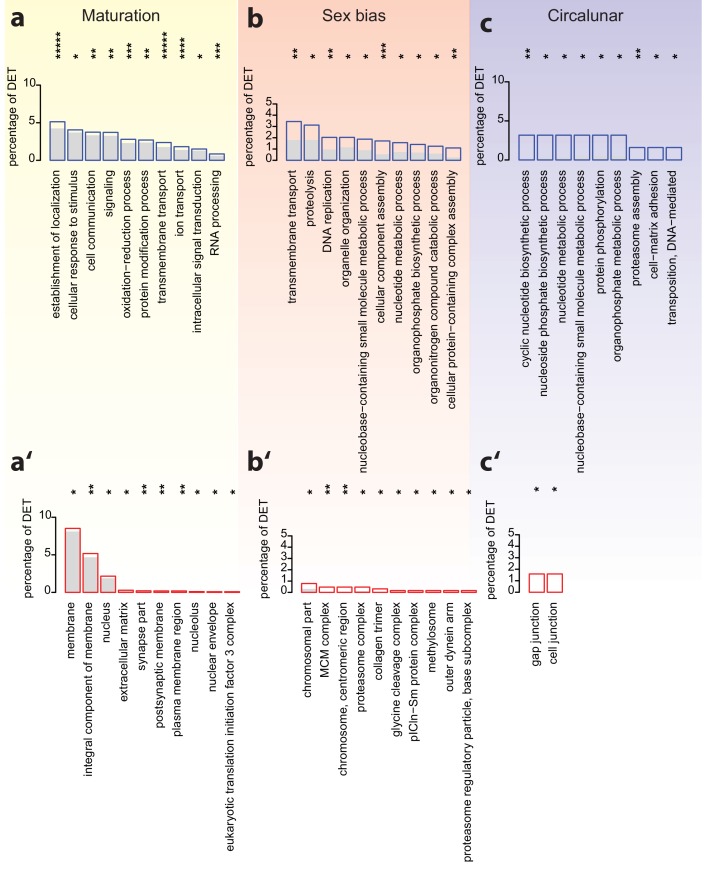
Figure 3—figure supplement 1. Analyses of over-represented GO-terms support the existence of distinct molecular signatures for maturation, sex and circalunar clock phase.

Figure 3—figure supplement 1.

(a–c) top 10 enriched terms in the Biological Process category; blue boxes: percentage of differentially expressed transcripts for each term; the grey bars: expected numbers of transcripts per category. Maturation: establishment of localization: GO:0051234, cellular response to stimulus: GO:0051716, cell communication: GO:0007154, signaling: GO:0023052, oxidation-reduction process: GO:0055114, protein modification process: GO:0036211, transmembrane transport: GO:0055085, ion transport: GO:0006811, intracellular signal transduction: GO:0035556, RNA processing: GO:0006396. Sex bias: transmembrane transport: GO:0055085, proteolysis: GO:0006508, DNA replication: GO:0006260, organelle organization: GO:0006996, nucleobase-containing small molecule metabolic process: GO:0055086, cellular component assembly: GO:0022607, nucleotide metabolic process: GO:0009117, organophosphate biosynthetic process: GO:0090407, organonitrogen compound catabolic process: GO:1901565, cellular protein-containing complex assembly: GO:0034622. Circalunar phase: cyclic nucleotide biosynthetic process: GO:0009190, nucleoside phosphate biosynthetic process: GO:1901293, nucleotide metabolic process, GO:0009117, nucleobase-containing small molecule metabolic process, GO:0055086, protein phosphorylation, GO:0006468, organophosphate metabolic process, GO:0019637, proteasome assembly, GO:0043248, cell-matrix adhesion, GO:0007160, transposition, DNA-mediated: GO:0006313. (a’–c’) In analogy to (a–c), these panels list the top 10 enriched terms in the Cellular Compartment category. Red boxes: percentage of differentially expressed transcripts for each term; the grey bars: expected values of transcripts per category. Maturation: membrane: GO:0016020, integral component of membrane: GO:0016021, nucleus: GO:0005634, extracellular matrix: GO:0031012, synapse part: GO:0044456, postsynaptic membrane: GO:0045211, plasma membrane region: GO:0098590, nucleolus: GO:0005730, nuclear envelope: GO:0005635, eukaryotic translation initiation factor three complex: GO:0005852. Sex bias: chromosomal part: GO:0044427, MCM complex: GO:0042555, chromosome, centromeric region: GO:0000775, proteasome complex: GO:0000502, collagen trimer: GO:0005581, glycine cleavage complex: GO:0005960, pICln-Sm protein complex: GO:0034715, methylosome: GO:0034709, outer dynein arm: GO:0036157, proteasome regulatory particle, base subcomplex: GO:0008540. Circalunar phase: gap junction: GO:0005921, cell junction: GO:0030054. For all analyses, statistical significance was tested with a hypergeometric test implemented in the GOStats package. *p < 0.05, **p < 0.01, ***p < 0.001, ****p < 0.0001, *****p < 0.00001.
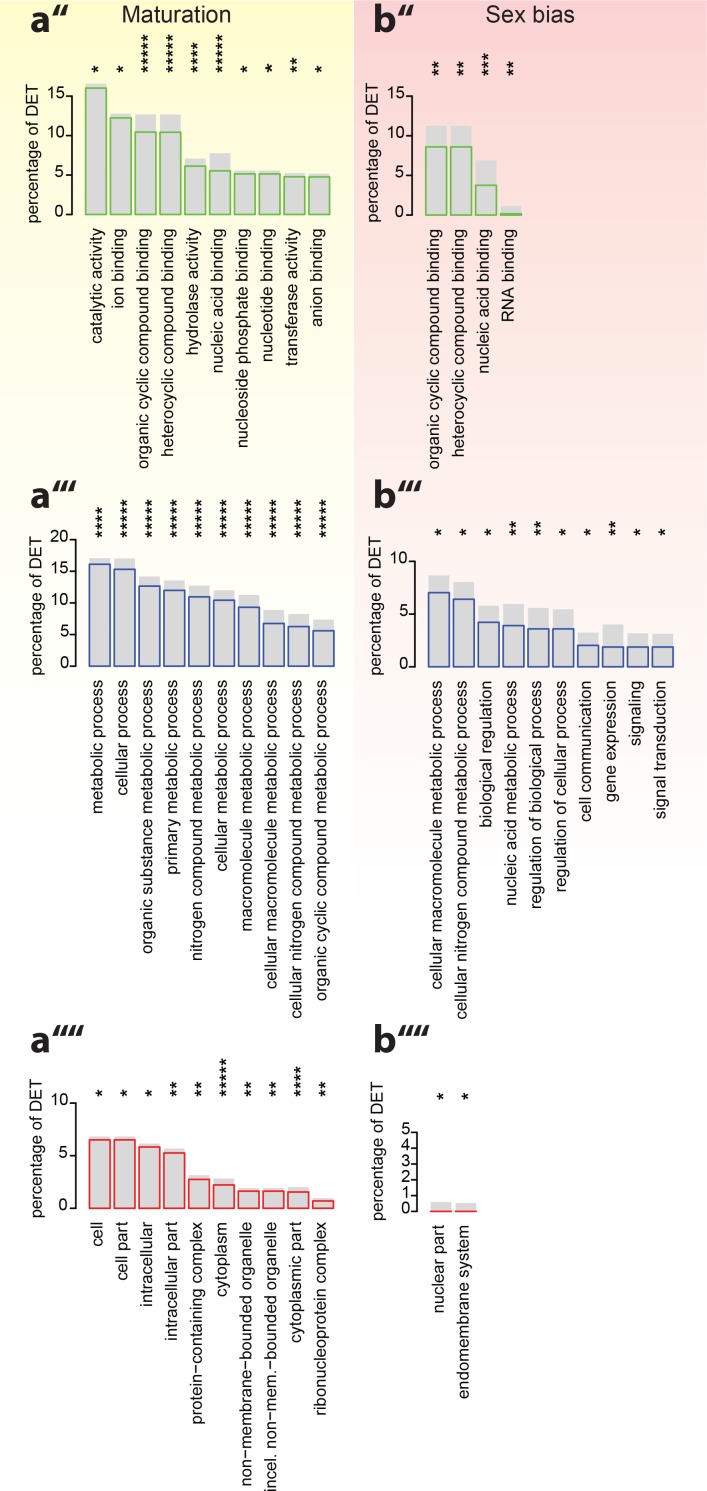
Figure 3—figure supplement 2. Analyses of under-represented GO-terms support the existence of distinct molecular signatures for maturation, sex and circalunar clock phase.

Figure 3—figure supplement 2.

(a’’–b’’’’) corresponding analyses focusing on top under-represented GO-terms; (a’’,b’’) top under-represented GO-terms in the Molecular Function category; Maturation: catalytic activity: GO:0003824, ion binding: GO:0043167, organic cyclic compound binding: GO:0097159, heterocyclic compound binding, GO:1901363, hydrolase activity, GO:0016787, nucleic acid binding, GO:0003676, nucleoside phosphate binding, GO:1901265, nucleotide binding, GO:0000166, transferase activity, GO:0016740, anion binding, GO:0043168. Sex bias: organic cyclic compound binding: GO:0097159, heterocyclic compound binding: GO:1901363, nucleic acid binding: GO:0003676, RNA binding: GO:0003723. Circalunar phase: no signifcantly under-respresented GO-terms at α ≤0.05. (a’’’,b’’’) Top underrepresented terms in the Biological Process category. Maturation: metabolic process: GO:0008152, cellular process: GO:0009987, organic substance metabolic process: GO:0071704, primary metabolic process: GO:0044238, nitrogen compound metabolic process: GO:0006807, cellular metabolic process: GO:0044237, macromolecule metabolic process: GO:0043170, cellular macromolecule metabolic process: GO:0044260, cellular nitrogen compound metabolic process: GO:0034641, organic cyclic compound metabolic process: GO:1901360. Sex bias: cellular macromolecule metabolic process: GO:0044260, cellular nitrogen compound metabolic process: GO:0034641, biological regulation: GO:0065007, nucleic acid metabolic process: GO:0090304, regulation of biological process: GO:0050789, regulation of cellular process: GO:0050794, cell communication: GO:0007154, gene expression: GO:0010467, signaling: GO:0023052, signal transduction: GO:0007165. Circalunar phase: no signifcantly underrepresented GO-terms at α ≤0.05. (a’’’’,b’’’’) Top under-represented terms in the Cellular Compartment category. Maturation: cell: GO:0005623, cell part: GO:0044464, intracellular: GO:0005622, intracellular part: GO:0044424, protein-containing complex: GO:0032991, cytoplasm: GO:0005737, non-membrane-bounded organelle: GO:0043228, intracellular non-membrane-bounded organelle (incel. non-mem.-bounded organelle): GO:0043232, cytoplasmic part: GO:0044444, ribonucleoprotein complex: GO:1990904. Sex bias: nuclear part: GO:0044428, endomembrane system: GO:0012505. Circalunar phase: no signifcantly underrespresented GO-terms at α ≤0.05. For all analyses, statistical significance was tested with a hypergeometric test implemented in the GOStats package. *p < 0.05, **p < 0.01, ***p < 0.001, ****p < 0.0001, *****p < 0.00001.
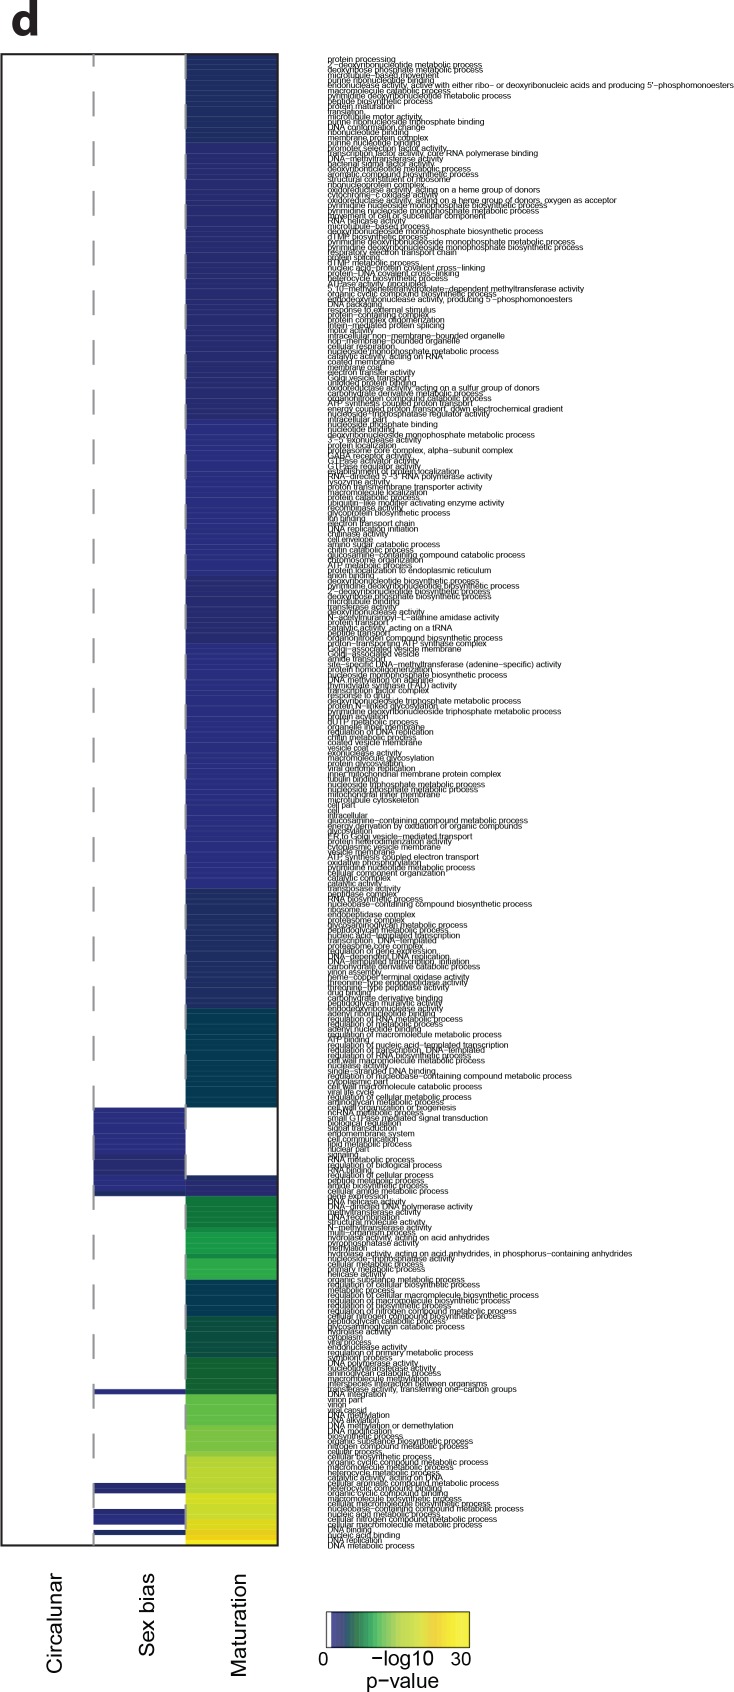
Figure 3—figure supplement 3. Heat map displaying under-represented GO-terms in all categories.

Figure 3—figure supplement 3.

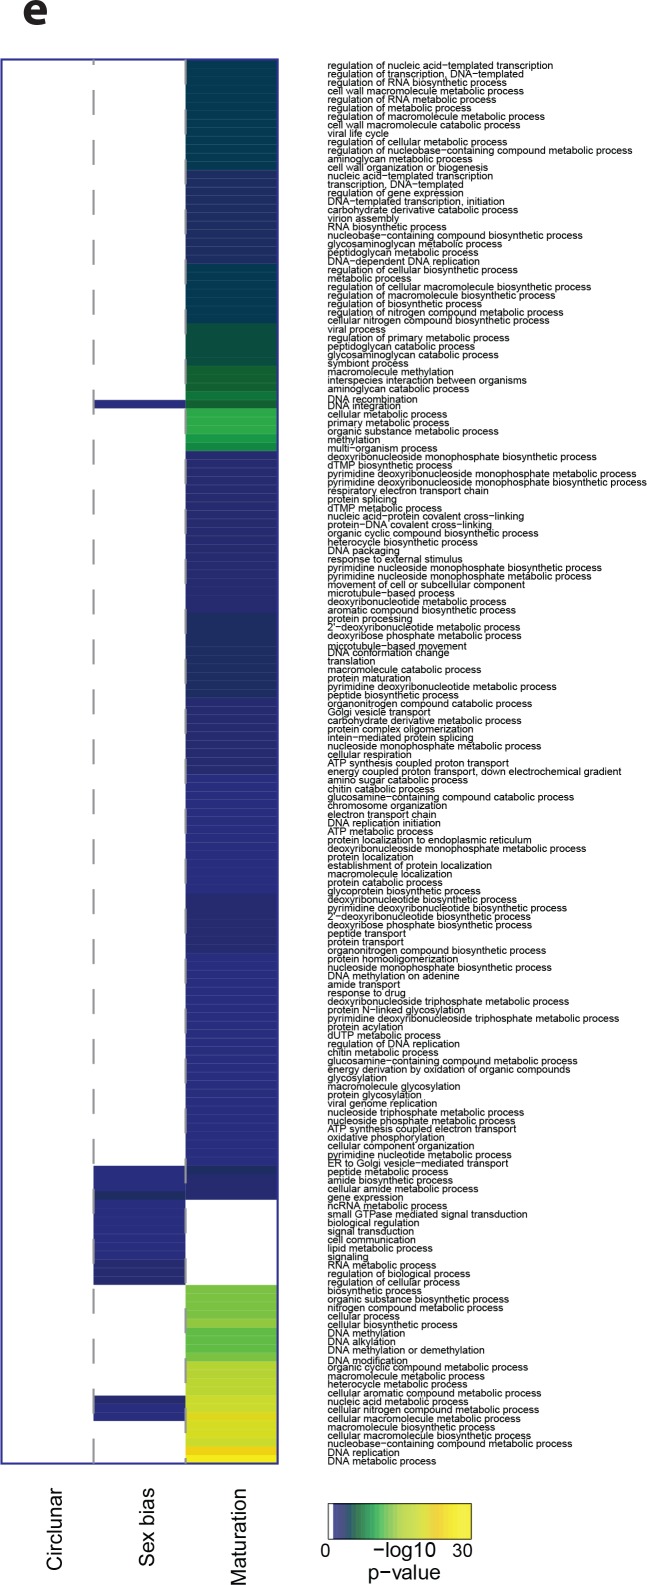
The heat map is subdivided (columns) by the regulation of each GO-term by circalunar clock phase (left), sex (middle) and/or maturation (right); colours are indicative of the enrichment p-value as calculated by a hypergeometric test implemented in the GOStats package.
Figure 3—figure supplement 4. Heat map displaying under-represented GO-terms in the Biological Process category.

Figure 3—figure supplement 4.

The heat map is subdivided (columns) by the regulation of each GO-term by circalunar clock phase (left), sex (middle) and/or maturation (right); colours are indicative of the enrichment p-value as calculated by a hypergeometric test implemented in the GOStats package.
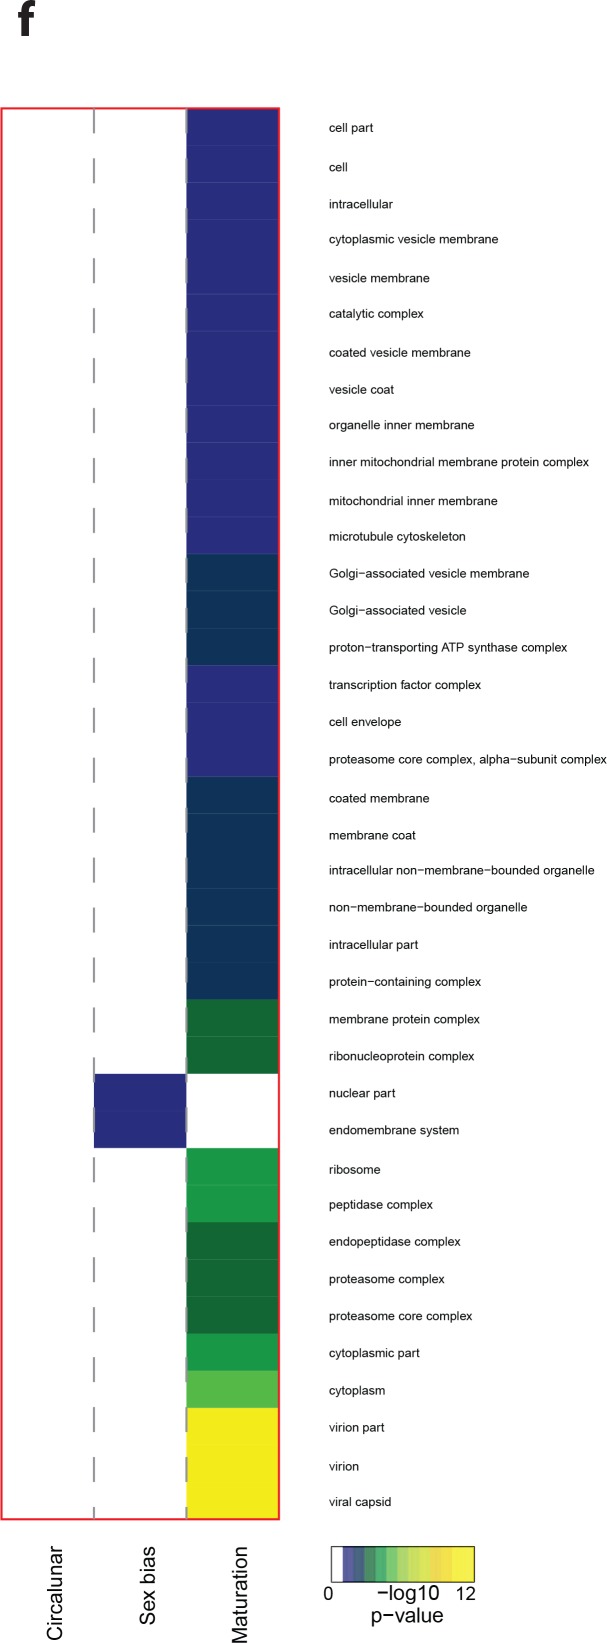
Figure 3—figure supplement 5. Heat map displaying under—represented GO-terms in the Cellular Compartment category.

Figure 3—figure supplement 5.

The heat map is subdivided (columns) by the regulation of each GO-term by circalunar clock phase (left), sex (middle) and/or maturation (right); colours are indicative of the enrichment p-value as calculated by a hypergeometric test implemented in the GOStats package.
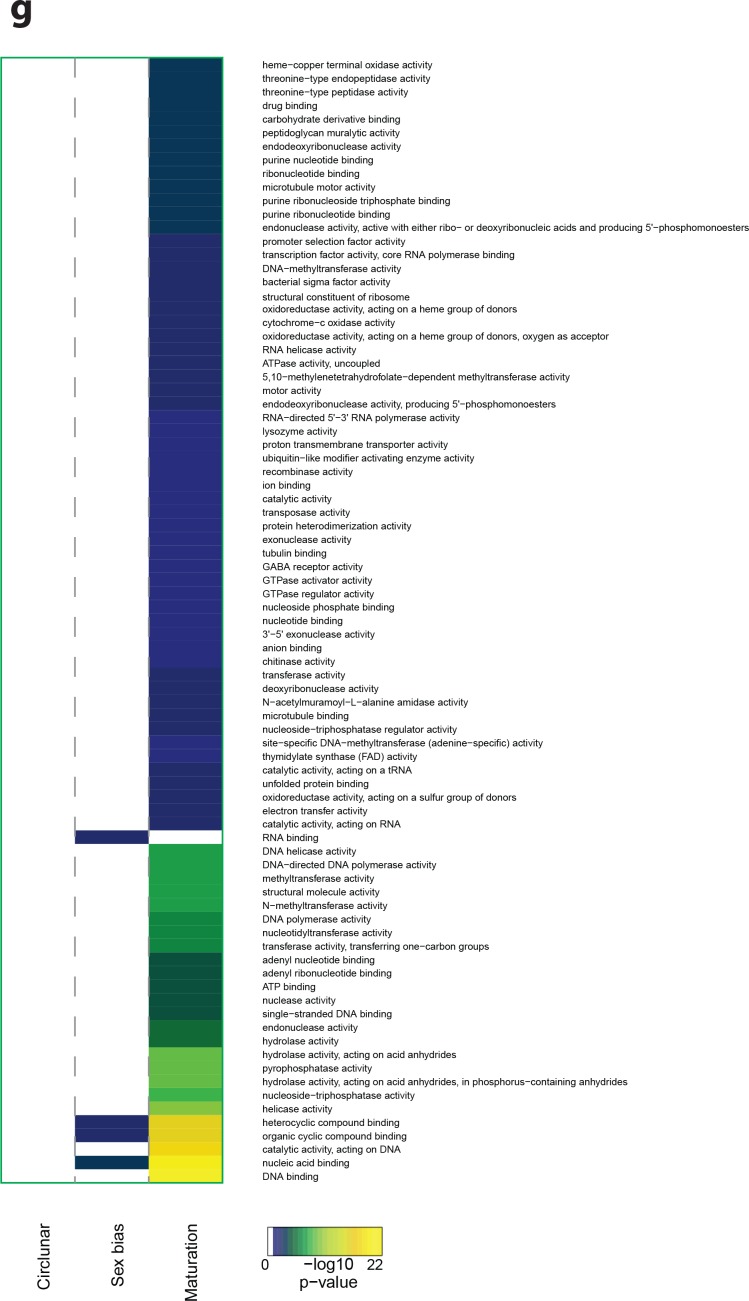
Figure 3—figure supplement 6. Heat map displaying under-represented GO-terms in the Molecular Function category.

Figure 3—figure supplement 6.

The heat map is subdivided (columns) by the regulation of each GO-term by circalunar clock phase (left), sex (middle) and/or maturation (right); colours are indicative of the enrichment p-value as calculated by a hypergeometric test implemented in the GOStats package.
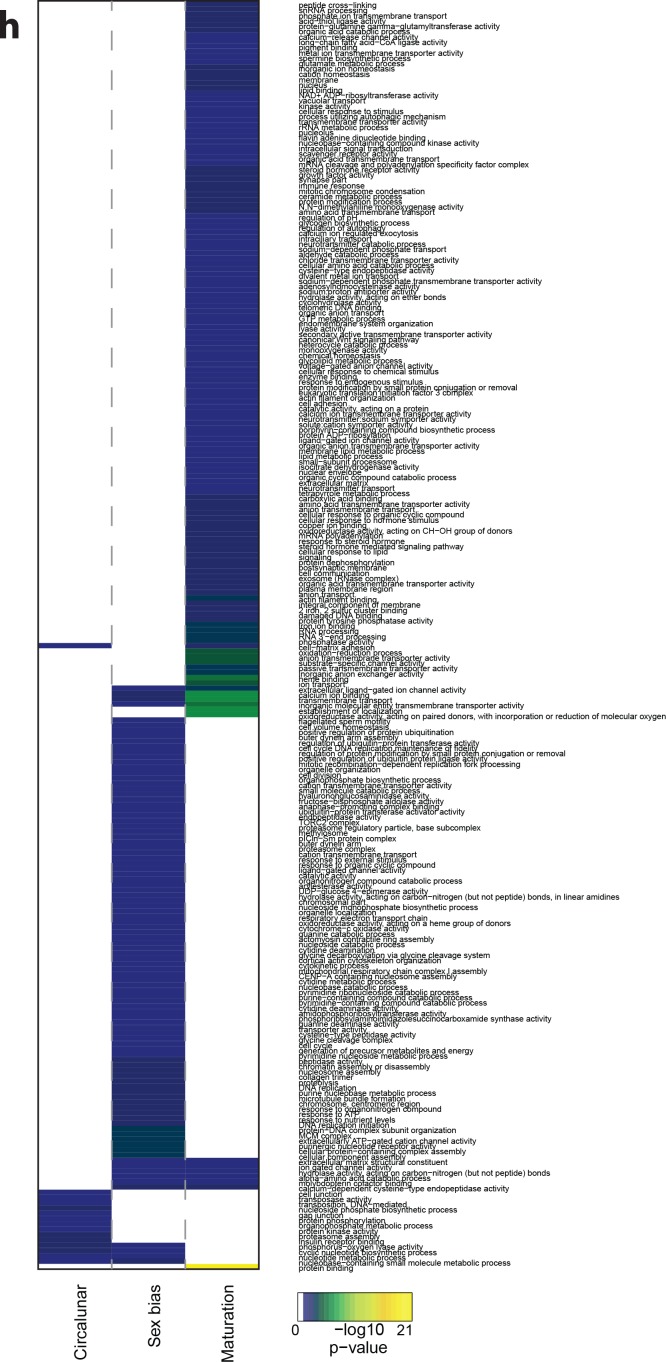
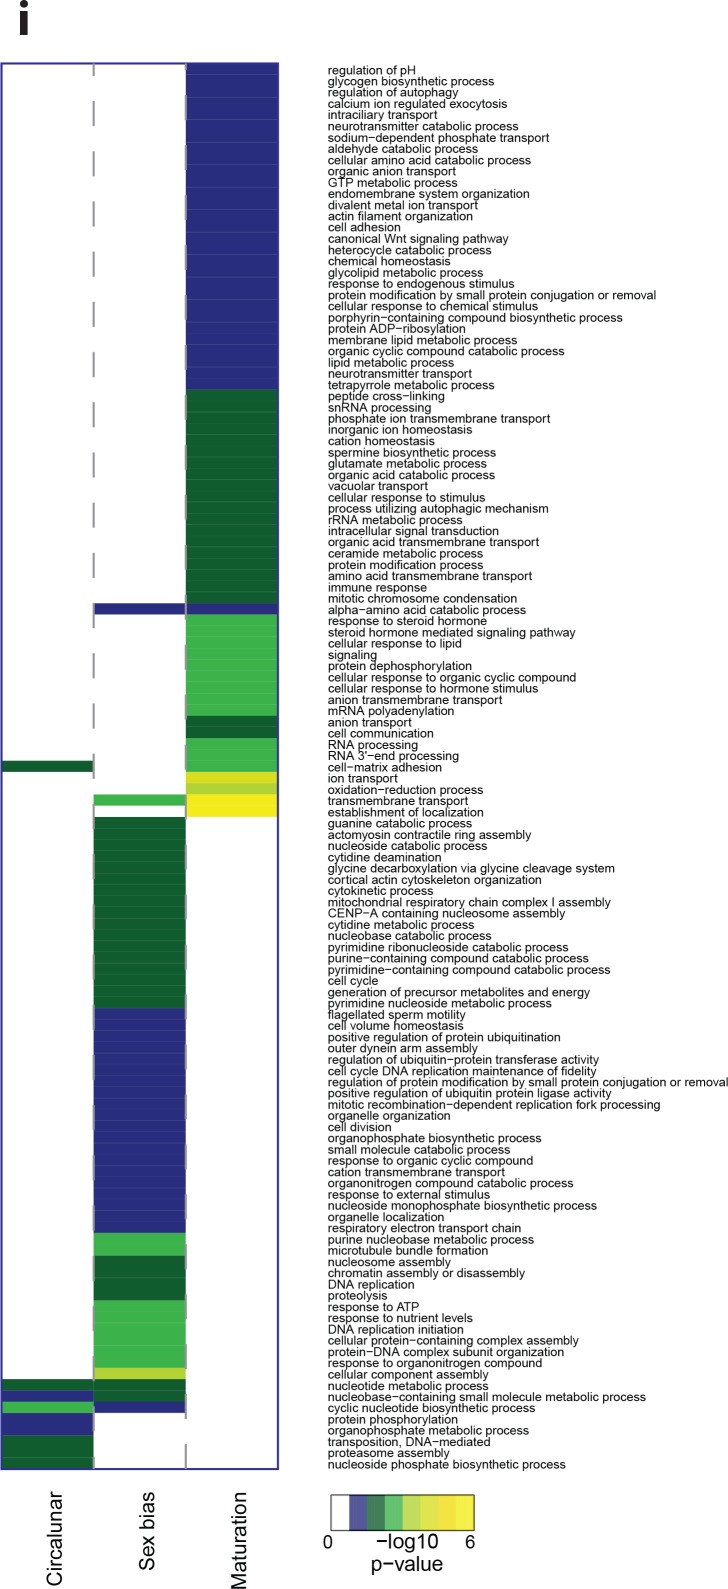
Figure 3—figure supplement 7. Heat map displaying over-represented GO-terms in all categories.

Figure 3—figure supplement 7.

The heat map is subdivided (columns) by the regulation of each GO-term by circalunar clock phase (left), sex (middle) and/or maturation (right); colours are indicative of the enrichment p-value as calculated by a hypergeometric test implemented in the GOStats package.
Figure 3—figure supplement 8. Heat map displaying over-represented GO-terms in the Biologcal Process categogy.

Figure 3—figure supplement 8.

The heat map is subdivided (columns) by the regulation of each GO-term by circalunar clock phase (left), sex (middle) and/or maturation (right); colours are indicative of the enrichment p-value as calculated by a hypergeometric test implemented in the GOStats package.
Figure 3—figure supplement 9. Heat map displaying over-represented GO-terms in the Cellular Compartment category.
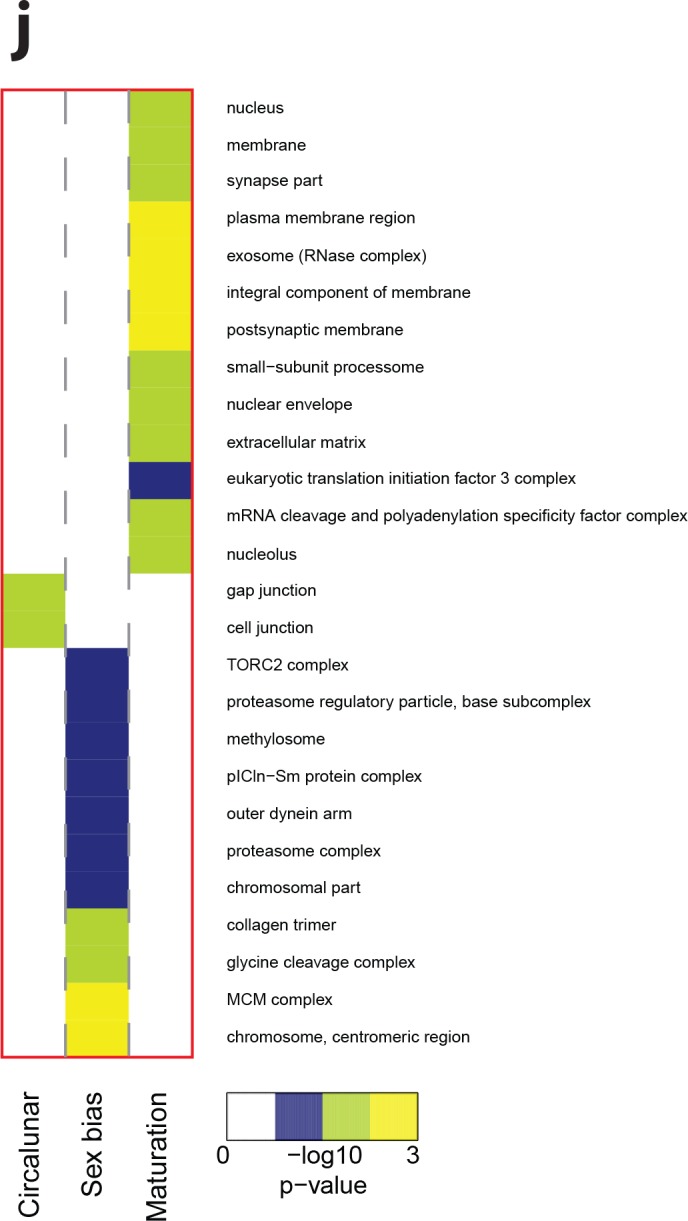
Figure 3—figure supplement 9.

The heat map is subdivided (columns) by the regulation of each GO-term by circalunar clock phase (left), sex (middle) and/or maturation (right); colours are indicative of the enrichment p-value as calculated by a hypergeometric test implemented in the GOStats package.
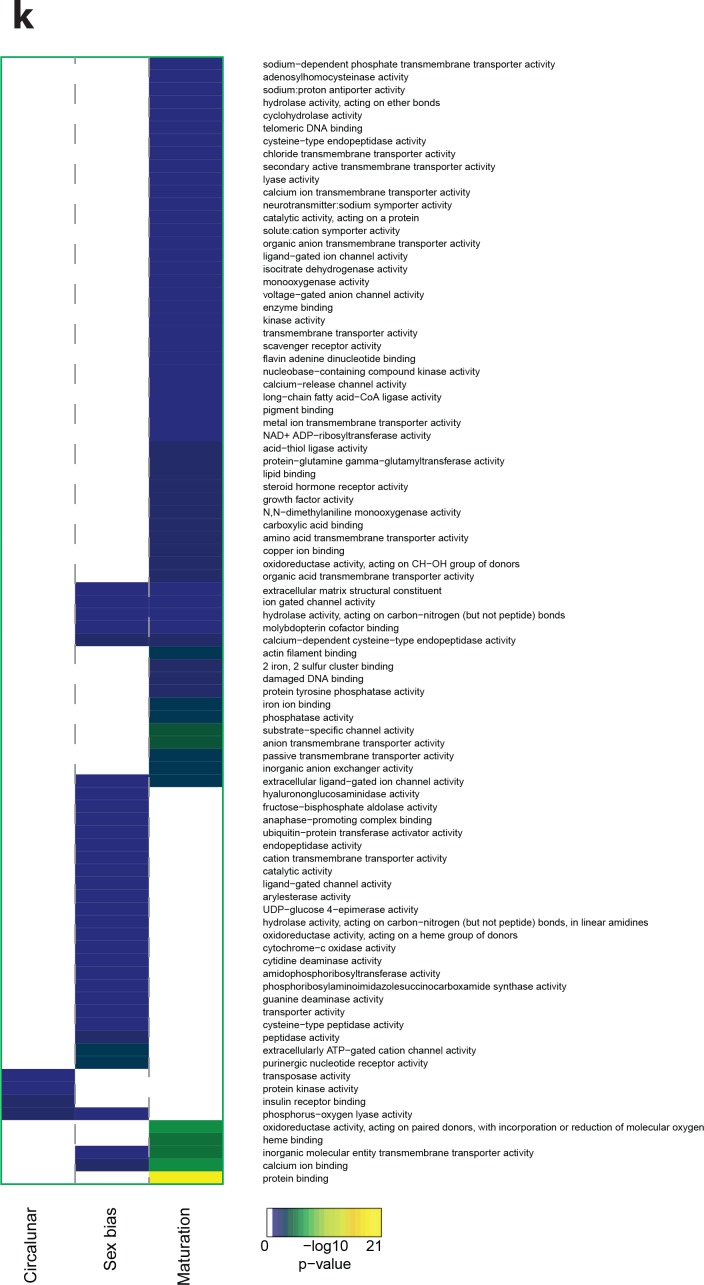
Figure 3—figure supplement 10. Heat map displaying over-represented GO-terms in the Molecular Function category.

Figure 3—figure supplement 10.

The heat map is subdivided (columns) by the regulation of each GO-term by circalunar clock phase (left), sex (middle) and/or maturation (right); colours are indicative of the enrichment p-value as calculated by a hypergeometric test implemented in the GOStats package.