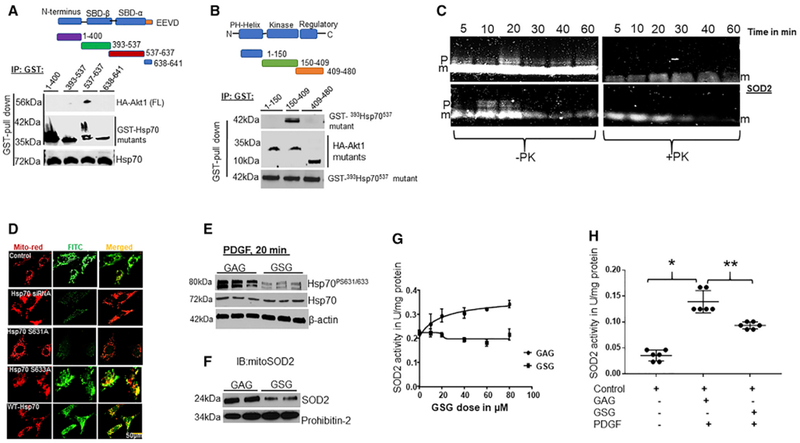
Figure 3. Ser631 Phosphorylation of Hsp70 Is a Pre-requisite for Induction of SOD2 Activity in Response to Stimuli.

Akt1 Binds to and Phosphorylates Hsp70.
(A) Schematic diagram of Hsp70 fragments used to map Akt1 binding sites in Hsp70 (top). Human GST-Hsp70 mutants (1–400, 393–537, 537–641)and HA-Akt1 (full-length) were co-transfected into HEK293T cells. Lysates were subjected to GST pull-down assays and blotted for Hsp70 fragments and HA epitope (bottom). The expression levels of transfected HA-Akt and GST-Hsp70 fragments were confirmed by WBs.
(B) Schematic diagram of Akt1 fragments used to determine the Hsp70 binding domain in Akt1 (top) (n = 6). HA-Akt1 fragments (1–150,150–408, 408–480) and a GST-393Hsp70537 were co-expressed in HEK-293T and the elute was blotted for HA and Akt1 fragments (bottom) (n = 6). In vitro phosphorylation of Hsp70 influences SOD2 import.
(C) 20 μL in vitro synthesized and FluoroTect GreenLys System BODIPY-FL-labeled-tRNA SOD2 was incubated with isolated bovine heart mitochondria (30 μg) in the presence of (10 μM) purified Hsp70 ± Akt1 (500 U) at 30°C for the indicated time. Detection of the fluorescently labeled SOD2 signal by an infrared scanner (LI-COR, Bioscience, n = 8) (p = precursor SOD2 and m = mature or intermediate SOD2).
(D) Disruption of Ser631 phosphorylation of Hsp70 influences SOD2 activity. PAECs were transfected with Hsp70-siRNA, and constructs expressing non-phosphorylable Hsp70 mutants (Hsp70ΔS631A and Hsp70ΔS633A) were re-expressed in Hsp70-depleted cells, and cells were subjected to IF staining after acetylcholine stimulation. Photomicrograph showing mitochondrial SOD2 localization in PAECs transfected with Hsp70-siRNA or Hsp70-siRNA and cells overexpressing Hsp70 WT or Hsp70 mutants (n = 5). Scale bar, 100 μm. The effect of disruption of Akt1 phosphorylation of Hsp70 by decoy peptide sequence GSG on SOD2 import.
(E) PAECs were incubated with 40 μM GSG or GAG overnight, and phospho-Ser631/633 proteins were measured following PDGF treatment using specific antiserum against phospho-Ser631/633.
(F) Detection of SOD2 proteins in isolated mitochondria after GSG or GAG treatment.
(G) Line graph showing the dose effects of GSG on SOD2 activity in PAECs. The effect of GSG peptide on PDGF induced SOD2 activity.
(H) PAECs were incubated with HBSS, GAG, or GSG and SOD2-specific activity was measured 20 min after PDGF treatment (n = 5; *, **p < 0.05 from HBSS and GSG treatments).
