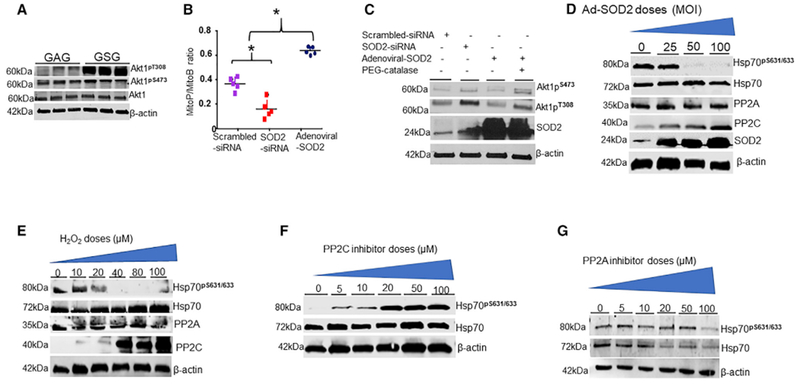
Figure 5. Mitochondrial Redox Signaling Involves PP2C.

The effects of mitochondrial ROS on Akt1 activation.
(A) PAECs were treated with 40 μM GSG for 2 hr and measured phosphorylated Akt1 on T308/S473 protein levels by IB (n = 4). H2O2 acts as a second messenger in SOD2 signaling. PAECs were transfected with SOD2-siRNA or adenoviral SOD2 (75 multiplicity of infection, MOI).
(B) Detection of mitochondrial H2O2 levels in transfected cells by LC-MS/MS quantification of MitoP-MitoB ratios relative to deuterated internal standards (n = 4) Scattered plot of MitoP-MitoB ratio (n = 5, *p < 0.05 from scramble).
(C) Detection of phosphorylated Akt1 in PAECs transfected with SOD2-siRNA and adenoviral SOD2 (75 MOI) in the presence or absence of 1,000 U polyethylene glycol (PEG)-catalase by WBs. H2O2 influences PP2C expression.
(D) PAECs transfected with varying doses of adenoviral SOD2 were blotted for PP2A and PP2C using indicated antibodies (n = 3). The effect of H2O2 on PP2C expression is shown.
(E) PAECs were treated with exogenous H2O2 for 1 hr, and the levels of PP2A and PP2C proteins were measured by IB (n = 3). Inhibition of PP2C influences Hsp70 phosphorylation.
(F and G) Detection of Ser631 phosphorylation of Hsp70 in PAECs treated with phosphatase inhibitors, Sanguinarine chloride (F) and (G) Calyculin A for 1 hr.
