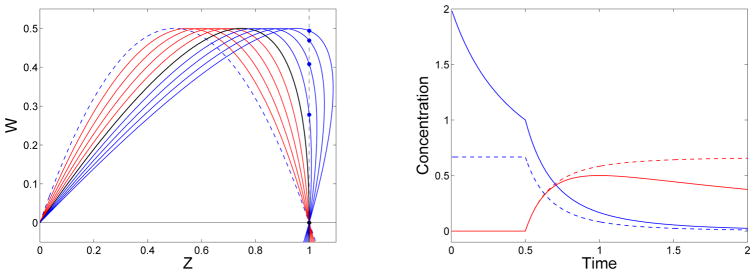
Figure 1.
Left: Solution curves W(z, t) at selected times: At t = 0 (blue dashed), for t < tg (red), for t = tg (black), and for t > tg (blue). W(t, 1) for t > tg (blue star). Right: Reactive sites in sol Rs (blue) and in gel Rg (red). Mass in sol θs (blue-dashed) and in gel θg (red-dashed). f = 3, .

