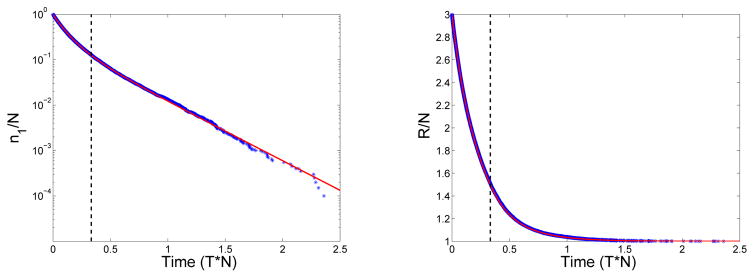
Figure 4.
Left: (Blue asterisks) Monomer fraction n1/N vs. time from a stochastic simulation with N monomers and (Red curve) monomer concentration c1 calculated using Eq. (13) from the deterministic GrS model. (Dashed Line) Time of gel formation from deterministic model. Right: (Blue asterisks) Concentration of reactive sites, (Σj rjnj)/N vs. time from the stochastic simulation and (Red curve) reactive site concentration R(t) from the deterministic GrS model. N = 20000, f = 3, n1(0) = N, and c1(0) = 1.

