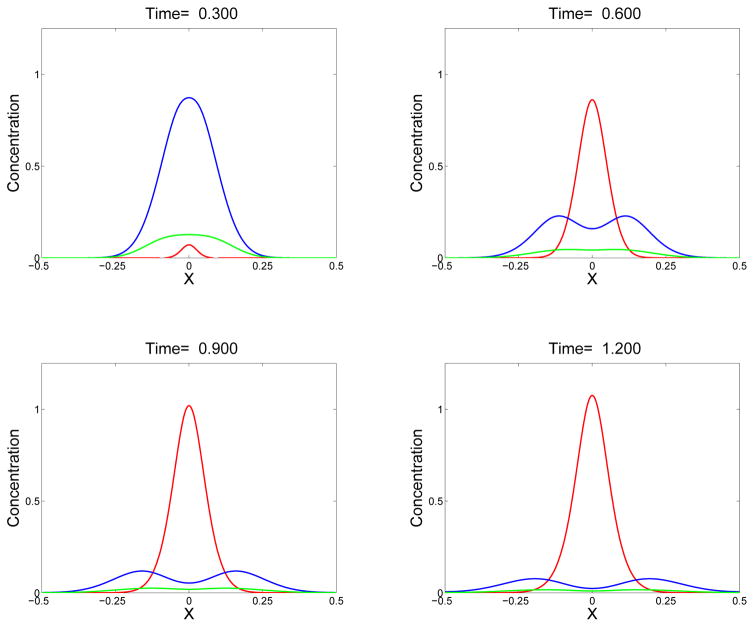
Figure 6.
Sequence of snapshots showing sol mass θs (blue), gel mass θg (red), and monomer concentration c1 (green) at the indicated times. Gel first appears shortly before t = 0.3. Simulations start with c1(x, 0) given by Eq. (45) with ε = 0.1 and Si = 1. D = D1 = 0.01.

