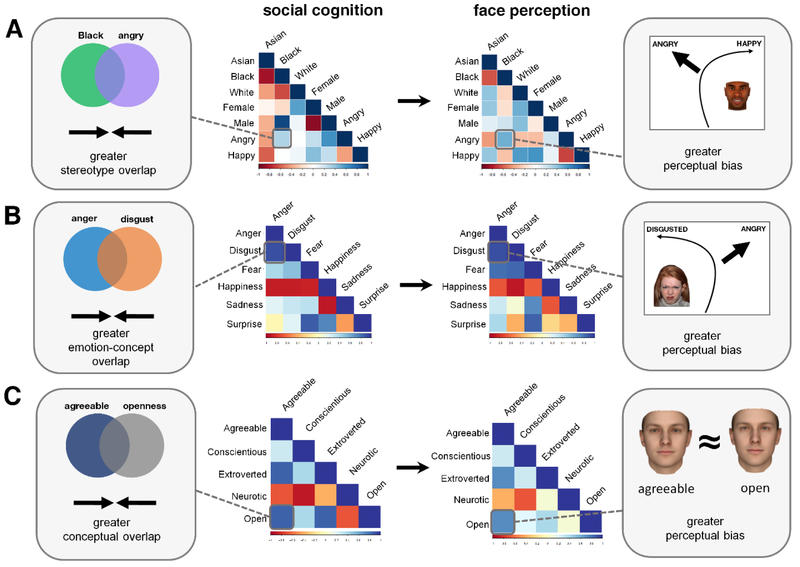
Figure 3. Representational similarity analysis (RSA) in social perception.
In RSA, representational dissimilarity matrices (RDMs) comprise all pairwise similarities/dissimilarities (see Fig. 4A) and are estimated for each modality. Unique values under the diagonal are vectorized, with each vector reflecting the geometry of the representational space. Correspondence in geometry is then assessed through the vectors’ bivariate relationships (e.g., correlation, regression). (A) Participants’ stereotype RDM (stereotype content task) predicted their perceptual RDM (mouse-tracking), showing that a biased similarity between two social categories in stereotype knowledge was associated with a bias to see faces belonging to those categories more similarly, which in turn was reflected in FG pattern structure [10]. (B) Participants’ emotion-concept RDM (emotion concept ratings task) predicted their perceptual RDM (mouse-tracking), showing that an increased similarity between two emotion categories in emotion-concept knowledge was associated with a tendency to perceive those facial expressions more similarly [30], which was also reflected in FG pattern structure [31]. (C) Participants’ conceptual RDM (trait ratings task) predicted their perceptual RDM (reverse correlation task), showing that an increased tendency to believe two traits are conceptually more similar is associated with using more similar facial features to make inferences about those traits [41].

