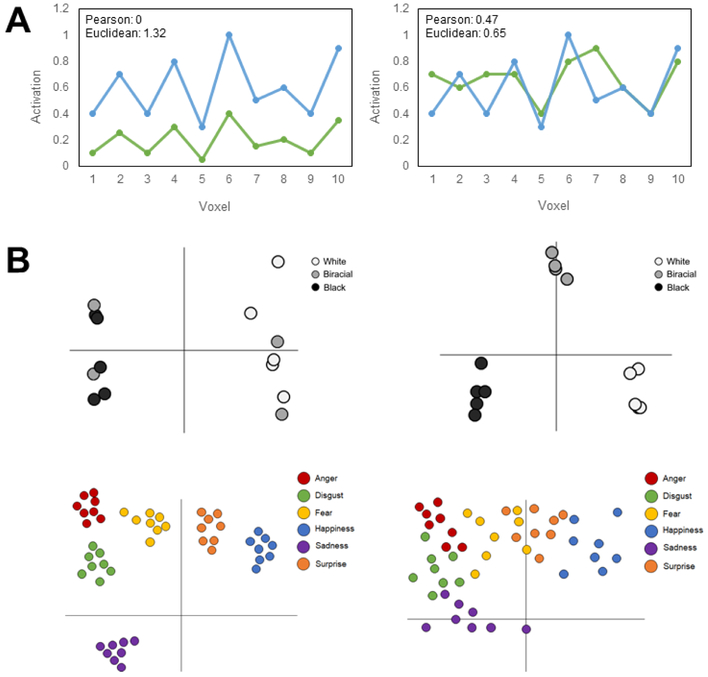
Fig. 4. Representational similarity and geometry.
(A) Representational dissimilarity matrices (RDMs), as in Fig. 3, comprise dissimilarities for all pairs of conditions. For simple cases, these dissimilarities – i.e., the distances between pairs of representations – can be derived by single values (e.g., behavioral similarity rating, mouse-trajectory deviation). In most cases, however, data are multivariate, and pairwise dissimilarities must be computed using distance metrics such as Pearson correlation distance or Euclidean distance. Consider the activation pattern of a brain region with 10 voxels. Pearson distance normalizes vector magnitude and scale, and thus in the case of multi-voxel patterns removes any differences in overall activation level and variability, leaving only the relative shape of the pattern that is typically of interest. Euclidean distance, on the other hand, combines sensitivity to relative pattern shape with absolute differences in magnitude and scale. On the left, for the two conditions’ multi-voxel patterns, Pearson distance is zero, because normalizing for magnitude and scale differences, the pattern is identical; Euclidean distance, however, is sensitive to these differences (i.e., how much higher one pattern is than another). On the right, the relative shape of the two conditions’ multi-voxel patterns are much less congruent, leading Pearson distance to be higher than on the left; Euclidean distance is lower than on the left, because incorporating magnitude and scale, the patterns are now more similar. Consider if the vector comprised 10 items on a stereotype survey (e.g., aggressive, communal), rather than 10 voxels, and the conditions were two social groups, such absolute differences in magnitude and scale may be important to capture (e.g., that one group is judged overall more aggressive and less communal than another). (B) Clustering and organization can also be informative. Hypothetical geometries (from multi-voxel patterns, behavioral data, or model simulations) are provided in a reduced, intuitive two-dimensional space. Top panel: When presented with White, Biracial, and Black faces, one region’s multi-voxel patterns may have a two-category organization, placing Biracial faces into either the White or Black cluster (left) whereas another region may have a three-category organization, such that Biracial faces are placed into their own distinct cluster (right). Bottom panel: When presented with emotional faces, certain perceivers may have a 6-category organization in behavioral data or neural patterns, such that each basic emotion has a distinct cluster (left), whereas other perceivers may have a more blended organization, such that various emotion expressions do not fit into the six distinct emotion categories. Thus, examining representational spaces in social perception may reveal important differences in the perceptual organization of different brain regions or individual perceivers.

