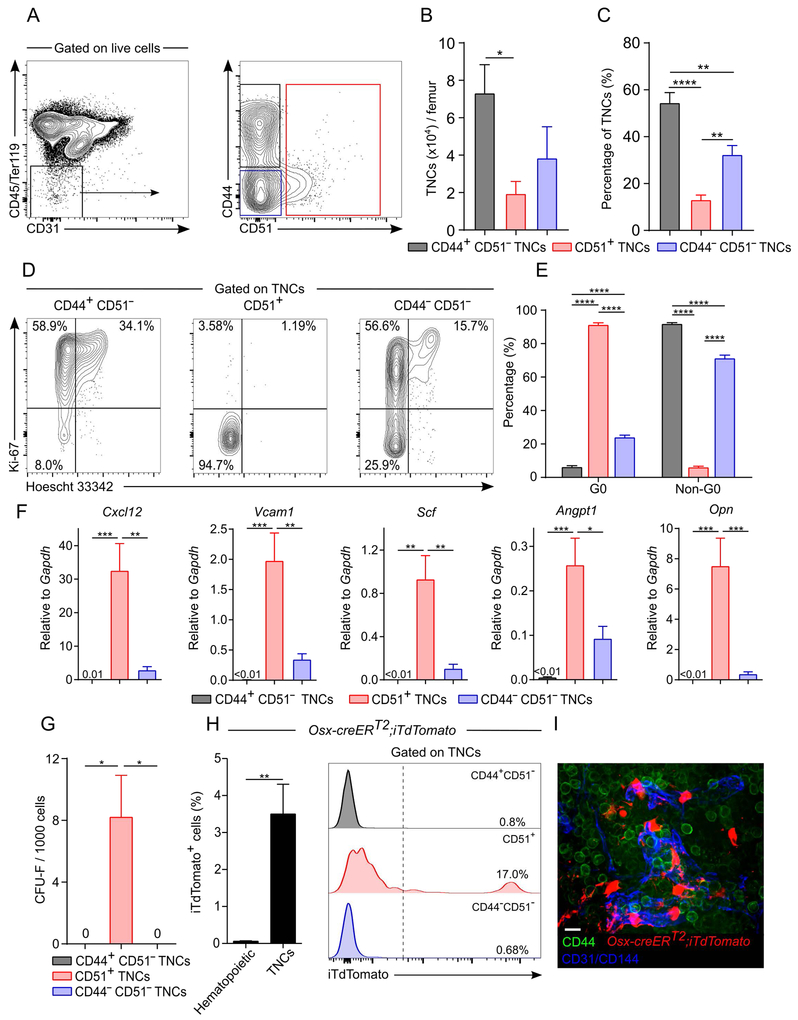
Figure 2. CD44 and CD51 expression in TNCs separates bona fide stromal cells from hematopoietic-derived TNCs.
A-C) Representative FACS plots (A), absolute (B) and relative (C) numbers of CD44 and/or CD51 expressing TNCs in enzymatically digested bone marrow. n=5 mice per group.
(D and E) Cell cycle analyses of TNCs by FACS using anti-Ki-67 and Hoescht 33342. Representative plots (D) and quantification (E) are shown. n=7-8 per group.
(F)Niche factor gene expression in sorted TNCs expressing CD44 and/or CD51 by qPCR. n=6-9 mice per group.
(G)CFU-F activity in TNC subsets. n=5 mice per group.
(H)Percentage of iTdTomato+ hematopoietic (CD45+/Ter119+) cells and TNCs from Osx-CreERT2;iTdTomato mice induced at post-natal day 5 and analyzed after 15 weeks of chase. Right panel shows TNC fractions. n=5 mice per group.
(I)Whole-mount image of sternal bone marrow from Osx-CreERT2;iTdTomato mice 15 weeks after tamoxifen injection at post-natal day 5 and stained with anti-CD44, anti-CD31 and anti-CD144 (VE-Cadherin) antibodies. Scale bar: 10 μm.
Statistical significance was assessed using one-way ANOVA followed by Tukey’s multiple comparison test (B, C, F, G), two-way ANOVA followed by Sidak multiple comparison test (E) and two-tailed t test (H). *P ≤ 0.05, **P ≤ 0.01, ***P ≤ 0.001, ****P ≤ 0.0001. Data are represented as mean ± SEM from at least 2 independent experiments.
See also Figures S1 and S2.

