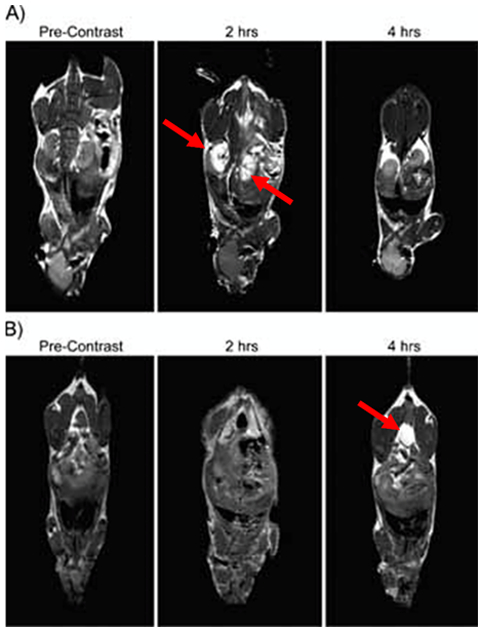
Figure 4.

T1 signal magnetic resonance images of C57BL/6 mice at various time points following the intravenous injection of gadolinium-encapsulated porous polymersomes. The local hyperintensity generated by the polymersomes was visualized using a 4.7 T small animal MR. Images of the A) kidney and B) bladder were acquired before injection, and at 2 h and 4 h post-injection, as indicated by the red arrows. Adapted with permission.[51]
