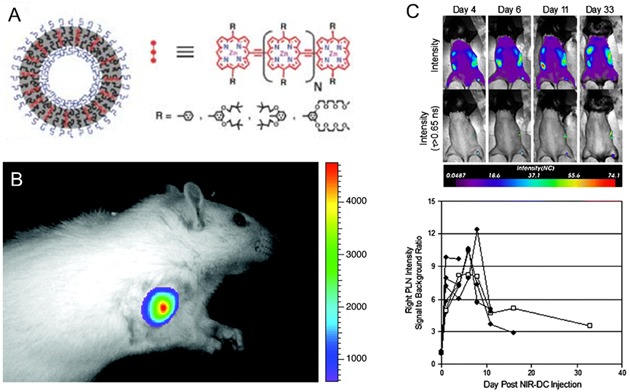
Figure 5.

Schematic depiction of the incorporation of various oligo(porphyrin)-based near infrared fluorophores within polymersomes. A. The near infrared fluorophores vary with the number of porphyrin subunits (N), the linkage topology between porphyrin monomers, and the nature and position of ancillary aryl group substituents (R). Reproduced with permission.[58] B. In vivo fluorescence image of 300 nm-sized NIR-emissive polymersomes taken 10 min after direct tumor injection of a 9L glioma-bearing rat. The intensity remained constant between successive images taken during a 20-min interval post-injection. Adapted with permission.[59] Copyright 2005, National Academy of Sciences. C. In vivo longitudinal tracking of NIR-dendritic cells migrating to the popliteal lymph node. Mice were scanned on days 1, 4, 6, 8, 11, 16, and 33 after a single subcutaneous injection of 105 NIR-dendritic cells into the right footpad. Representative intensity maps (top row) and corresponding lifetime-gated intensity maps (bottom row) for a single mouse are presented for days 4, 6, 11, and 33. The measured signal-to-background ratio for right popliteal lymph node intensity is shown versus day. Each trace (n = 6) represents a different mouse and terminates on the day each animal was sacrificed. Trace with open squares is quantification of the images appearing above. Reproduced with permission.[60] Copyright 2009, Springer.
