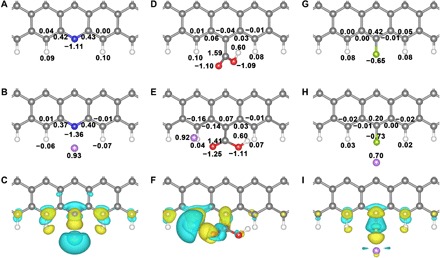
Fig. 4. The Bader charge and differential charge analyses.

The Bader charge distribution before and after adsorption, and the corresponding differential charge density of Li adsorption site of (A to C) pN-, (D to F) aO-, and (G to I) F-GNRs, respectively. The black numbers are the Bader charge of the nearest atoms. The yellow and cyan surfaces correspond the charge gain and lost regions, respectively (isovalue, 0.0025). The hydrogen, lithium, carbon, nitrogen, oxygen, and fluorine atoms are marked as white, purple, gray, blue, red, and cyan, respectively.
