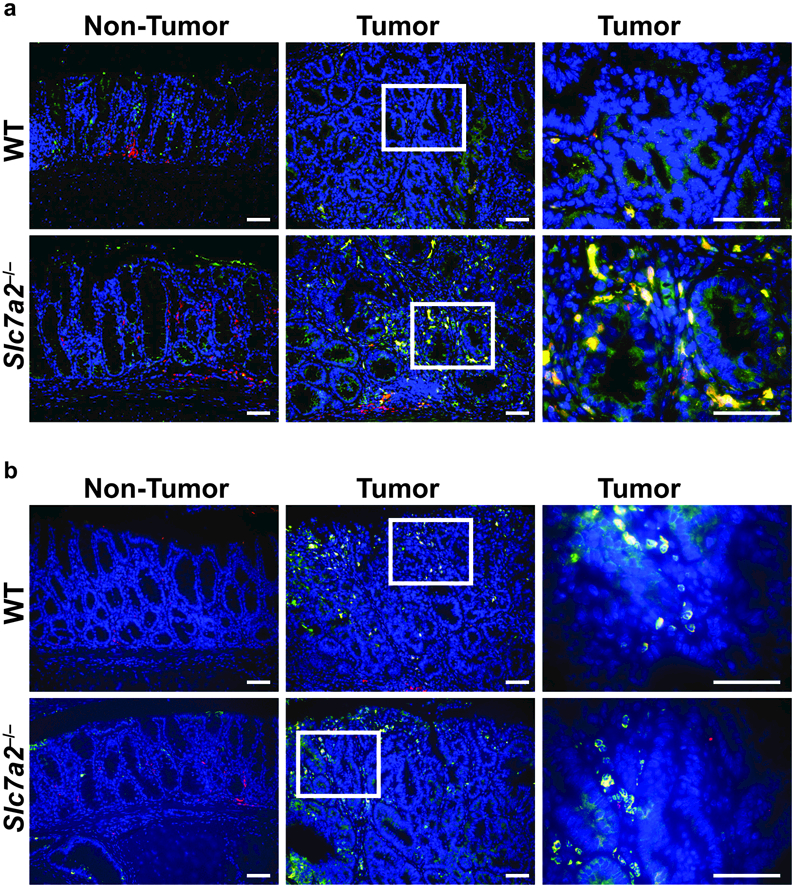
Figure 5. ARG1+CD68+ macrophages are increased in Slc7a2–/– AOM-DSS tumors.

Representative images of immunofluorescence staining for (a) macrophage marker, CD68 (red); M2 marker, ARG1 (green); CD68+ARG1+ cells (yellow, merge). Cell nuclei, DAPI (blue). (b) Macrophage marker, CD68 (red); M1 marker, NOS2 (green); CD68+NOS2+ cells (yellow, merge). Cell nuclei, DAPI (blue). Representative merged images of at least 3 per group. Scale bars = 50 μm.
