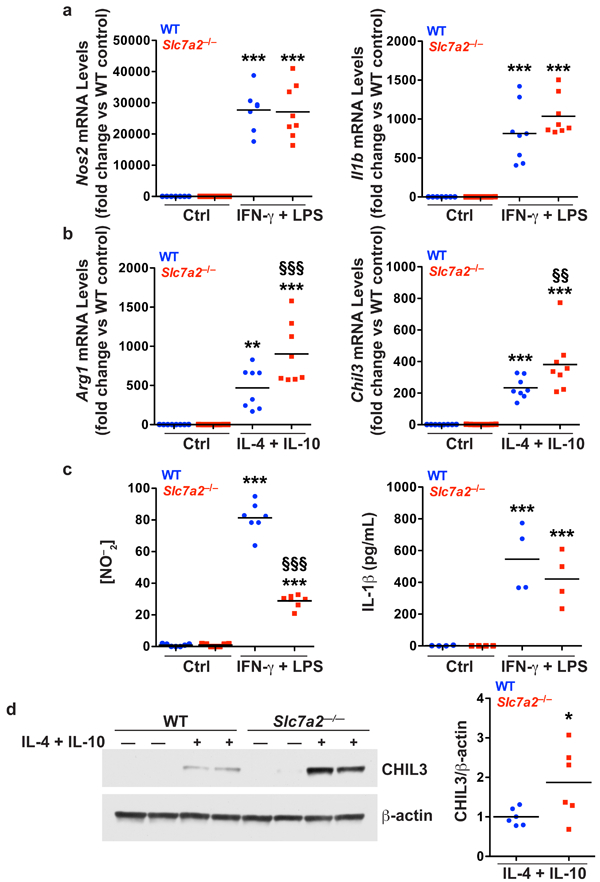
Figure 6. Bone marrow-derived macrophages (BMmacs).

BMmacs were stimulated with classical M1 stimuli, IFN-γ (200 U/mL) and LPS (100 ng/mL), or M2 stimuli, IL-4 (10 ng/mL) and IL-10 (10 ng/mL), for 24 hours. Cells were collected for isolation of RNA and protein. The supernatants were collected. (a) mRNA levels of M1 markers, Nos2 and Il1b, were assessed by qRT-PCR in unstimulated (Ctrl) or stimulated cells. (b) mRNA levels of M2 markers, Arg1 and Chil3, were assessed by qRT-PCR in unstimulated (Ctrl) or stimulated cells. (c) Concentration of NO–2 in the supernatants assessed by Griess assay, and IL-1β in the supernatant assessed by ELISA, in unstimulated (Ctrl) or stimulated cells. n = 4–8 biological replicates per genotype. In (a-c), **P < 0.01 and ***P < 0.001 versus WT unstimulated; §§P < 0.01 and §§§P < 0.001 versus WT stimulated, by one-way ANOVA with Newman-Keuls post-test. (d) Representative Western blot of CHIL3 levels in BMmacs activated with M2 stimulus for 24 hours. n = 3 biological replicates. Combined densitometry shown. In (d), *P < 0.05 versus WT stimulated by Student’s t test.
