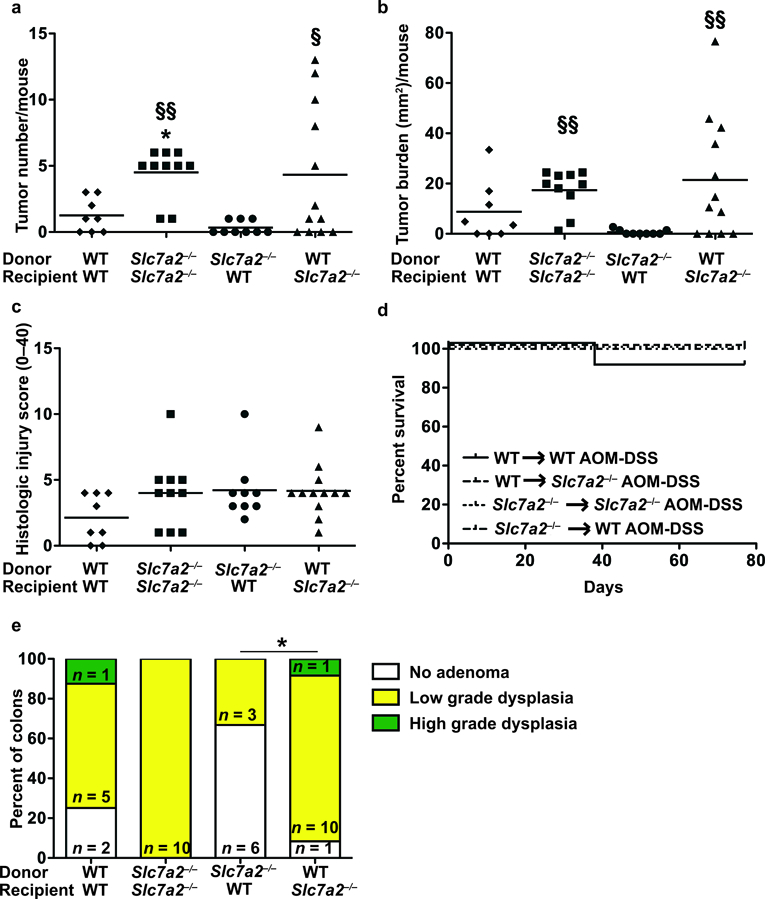
Figure 7. Bone marrow transplant between WT and Slc7a2–/– mice.

Irradiated animals were given bone marrow-derived hematopoietic cells and were treated with AOM-DSS. (a) Tumor number was assessed by gross visual inspection, utilizing a dissecting microscope. (b) Tumor burden was determined by the addition of the calculated area of each identified tumor, as assessed with an electronic caliper for both length and width. (c) Histologic colitis was determined by a gastrointestinal pathologist (M.K.W.) in a blinded manner. In (a), (b), and (c), *P < 0.05 versus WT to WT AOM-DSS; §P < 0.05 and §§P < 0.01 versus Slc7a2–/– to WT AOM-DSS, by one-way ANOVA with Student-Newman-Keuls posthoc multiple comparisons test. (d) Survival curve assessed by log-rank (Mantel-Cox) test. (e) Percentage of cases with either no adenoma, low grade dysplasia, and high grade dysplasia determined by a gastrointestinal pathologist (M.K.W.) in a blinded manner. By Chi Square test, *P < 0.05. n = 8–12 AOM-DSS-treated animals per transplant type.
