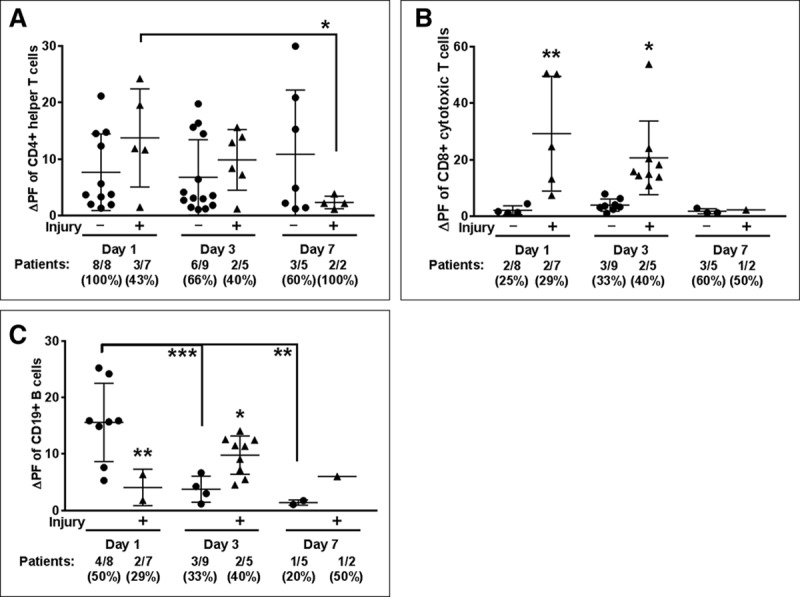
Figure 4.

Brain injury associated with cytotoxic T cell autoreactivity to CNS antigens. Autoreactivity data separated by brain injury were analyzed by two-way analysis of variance, Fisher Least Significant Difference. Positive responses (change in proliferation fraction [ΔPF]) from all patients tested (#/#) and corresponding % indicated below graph. A, CD4 helper T cell responses did not differ between extracorporeal membrane oxygenation (ECMO) patients without brain injury (circles) and those with brain injury (triangles). B, Autoreactive CD8 T cell responses were, however, more abundant in brain injury ECMO patients, and (C) B cell autoreactivity was increased ECMO patients without brain injury at day 1, which was reversed by day 3 as brain-injured ECMO patients exhibited increased autoreactivity. Significance between groups on an individual day is shown as *p < 0.05, **p < 0.01, ***p < 0.001 or between groups, as indicated by brackets.
