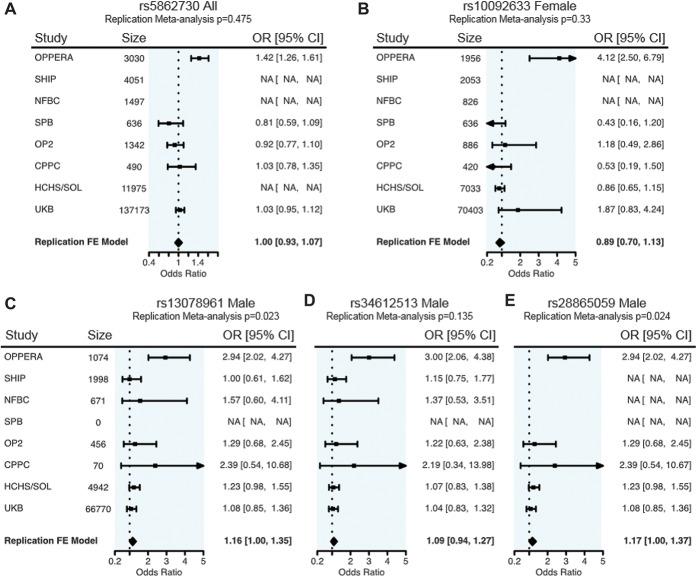
Figure 4.
Forest plots for associated SNPs in OPPERA and the replication cohorts. The OR and 95% CI for the OPPERA discovery cohort are given in the first row. Odds ratio and 95% CI values for all available replication cohorts are provided in subsequent rows, and the final row indicates the meta-analysis effect in replication cohorts only, not including the discovery cohort. The P value at the top of each plot pertains to the meta-analysis effect in replication cohorts only. (A) chr4: rs5862730, male and female combined; for the replication meta-analysis, Cochrane's Q P = 0.37, I2 = 5.4. (B) chr8: rs10092633, females only, Cochrane's Q P = 0.16, I2 = 38.3. (C) chr3: rs13078961, males only, Cochrane's Q P = 0.79, I2 = 0.0. (D) chr3: rs34612513, males only, Cochrane's Q P = 0.95, I2 = 0.0. (E) chr3: rs28865059, males only, Cochrane's Q P = 0.65, I2 = 0.0. CI, confidence interval; OR, odds ratio; SNP, single-nucleotide polymorphism.

