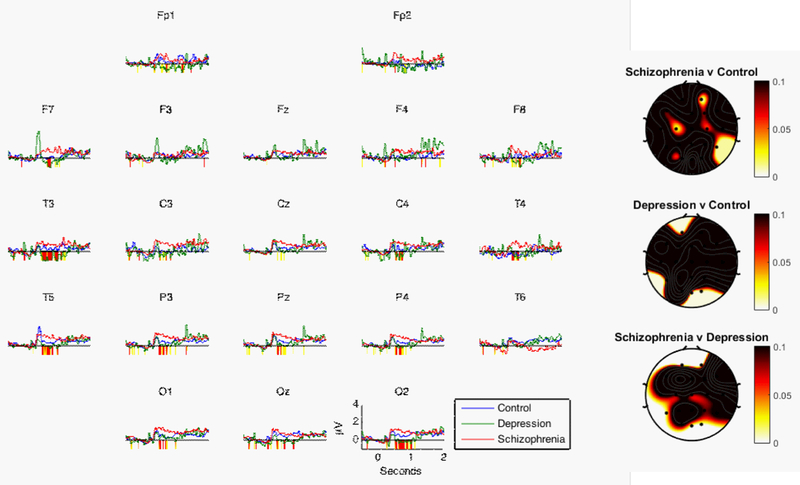
Figure 1.
Line graphs show mean EEG gamma power (35–45 Hz) over the first two seconds of the processing window by group in response to positive words. Periods of significant differences between the schizophrenia and control groups are highlighted below the x-axis (yellow: p < 0.1; red: p < 0.05). Head plots show p-values for the early period from Table 3.

