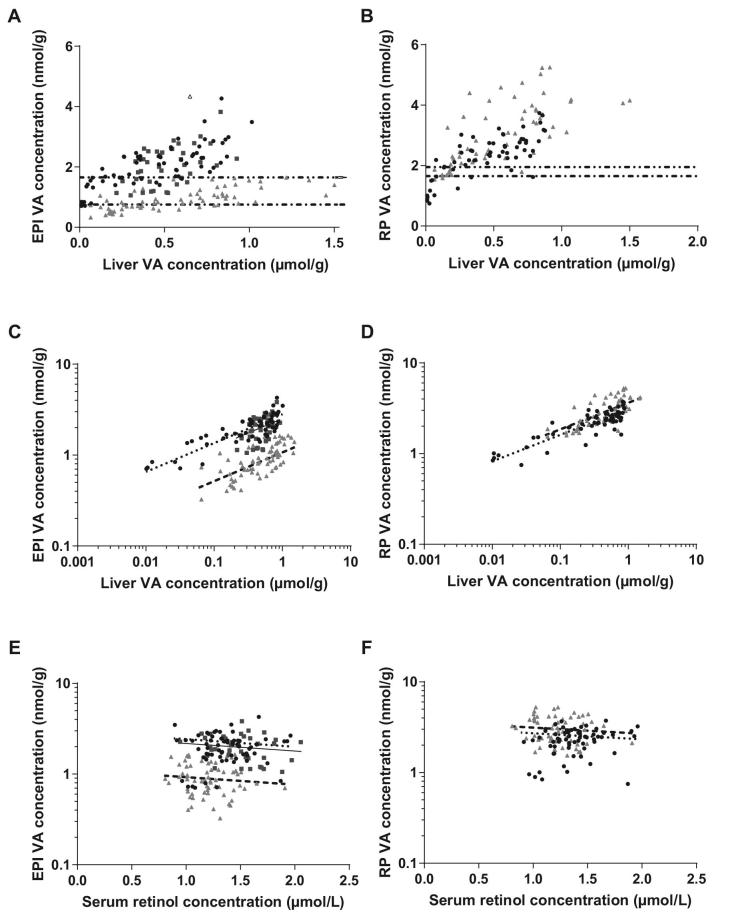
FIGURE 1.
Tissue VA (as retinol + retinyl esters), determined by HPLC (liver and serum) or UPLC (adipose tissue) in Studies 1 (black circles), 2 (dark grey squares), and 3 (light grey triangles). RP tissue was only available in Studies 1 and 3. (A, B)  Example cutoff for deficiency for Studies 1 and 2.
  Example cutoff for deficiency for Study 3. (A) Liver and EPI retinol concentrations. The data point with an open symbol was an outlier and excluded from further analysis. A further outlier at (0.33, 6.50) was off-axis and also excluded. (B) Liver and RP retinol concentrations. (C–F) ANCOVA including liver, serum, and either EPI (C, E) or RP (D, F) tissue VA was performed after base-10 logarithmic transformation of liver and adipose VA concentrations in Studies 1 (
 ), 2 (—), and 3 (– – –), with study as a covariate. (C, D) Liver VA concentration explained 28% (D, EPI) and 57% (E, RP) of the variation in adipose VA concentration (P < 0.001). (E, F) Serum retinol concentration explained a negligible fraction of the variation in adipose VA concentration. EPI, epididymal adipose; RP, retroperitoneal adipose; UPLC, ultra-performance LC; VA, vitamin A.

