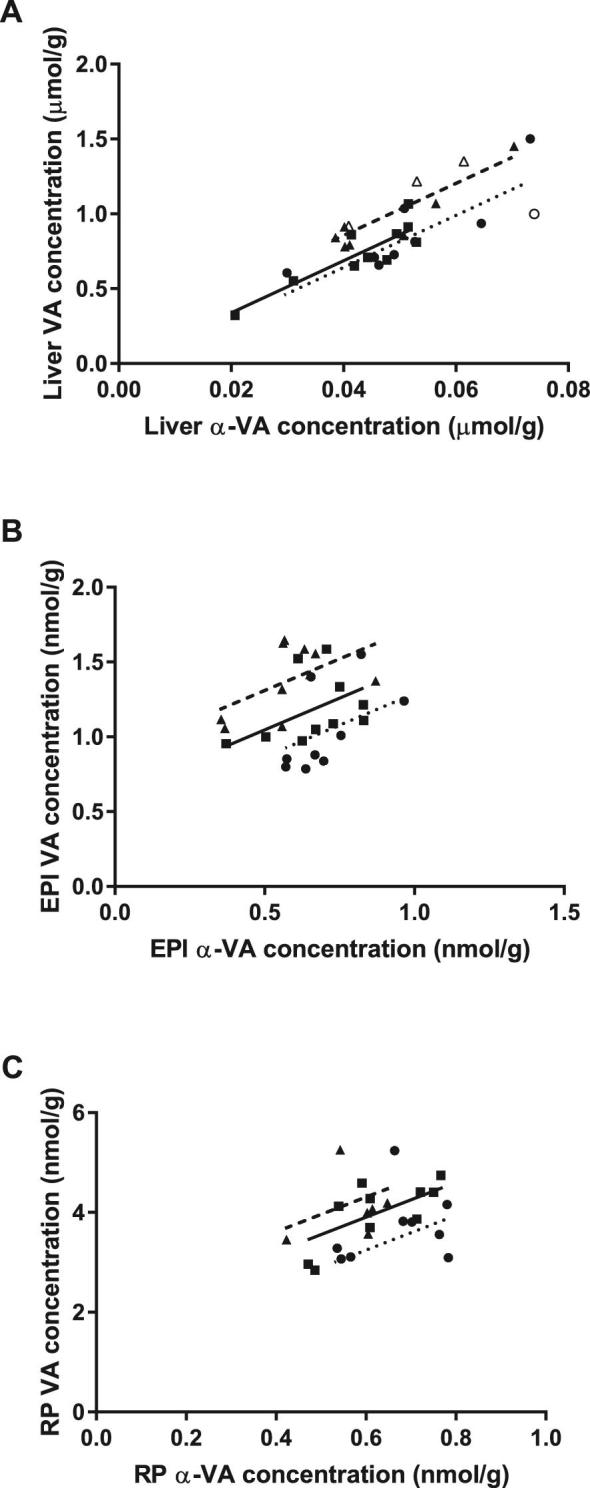
FIGURE 3.

The fraction of the variation in tissue VA concentration from all sources explained by chylomicron deposition in ANCOVA, measured as α-VA concentration, both determined by HPLC (liver) or UPLC (adipose). Dietary treatment was added as a covariate to control for different quantities of preformed VA [0 (●,  ); 0.5 (■, —); 1 (▲, – – –) μg/g feed] in each group. (A) α-VA concentrations explained >60% (P < 0.001) of the variation in VA concentration in liver. Data points with open symbols were from gerbils which were included in the EPI analysis but lacked RP samples. (B, C) α-VA concentration explained 15% (P = 0.012; B, epididymal) and 25% (P = 0.004; C, retroperitoneal) of the variation in retinol concentration in adipose. EPI, epididymal adipose; RP, retroperitoneal adipose; UPLC, ultra-performance LC; VA, vitamin A.
