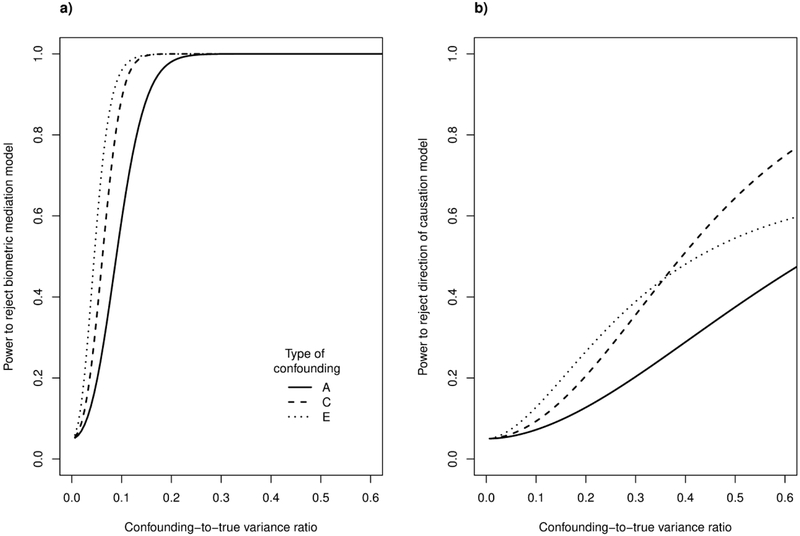
Figure 2.
Statistical power to detect confounding. a) Power when comparing biometric mediation model to a Cholesky model with unconstrained additive genetic (A) and non-shared (C) and shared (E) environmental covariance structures, plotted as a function of the degree of A-, C-, and E-type confounding. The confounder always had a uniform influence on all variables, as illustrated in Figure 1c. b) Power in a similar analysis for the direction of causation model (cf. Figure 1d). The analysis is based on 678 monozygotic and 732 dizygotic twins and continuous-variate (non-EIV) versions of the respective models, with all phenotypic regression coefficients at 0.8 and all unconfounded A, C, and E variances at 1/3.

