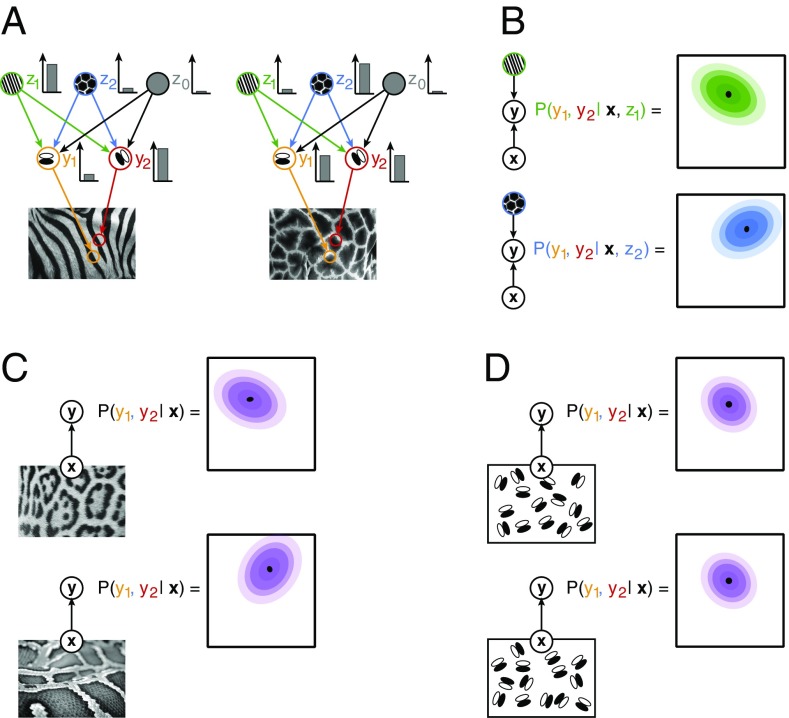
Fig. 1.
Illustration of inference in a hierarchical statistical model. (A) An image, x, is assumed to be generated by combining features of different complexity: high-level features, zi (green and blue circles), determine the large-scale structure of low-level features, for example, textures determine the joint statistics of edges (z0 is a bias term that represents an interpretation where no higher-order structure is present). Low-level features, yi, capture simple regularities in images, for example, darker and lighter image areas underlying edges (orange and red circles). In the visual system, upon presentation of a stimulus, the contribution of different features to the observed image is inferred: different images (Left and Right) elicit different intensity responses from the neurons (Inset bar plots). (B) The statistical internal model establishes a joint probability distribution for the coactivation of low-level features upon observing a stimulus: beyond the most probable joint activations (black dots), a wide range of coactivations is compatible with the high-level percept, albeit with different probabilities (colors matching those on A). Given the activation of a particular high-level feature (z1 or z2 for the Left and Right, respectively), the joint distribution over activations of low-level features (contours) displays a covariance specific to the high-level feature. (C) The posterior distribution for low-level features is characterized both by the mean and covariance of the distribution (Top). Posterior distribution for a distinct structured image (Bottom) is characterized by a different mean and correlation structure. (D) A stimulus with no higher level structure is invoking an interpretation that low-level features are independent; therefore, the correlation structure of images with only low-level structure will be identical. Arrows define conditional dependencies throughout the figure.

