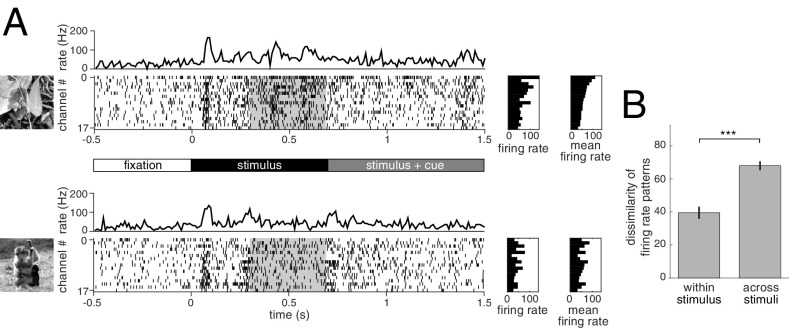
Fig. 2.
Structure of the experiment and mean neural responses. (A) Time course of neural activity upon the presentation of two natural images (Top and Bottom). After presenting a fixation point for 500 ms (timeline in Middle), a pair of stimuli are presented off-foveally at equal distances from the fixation point. One of the images (shown on the Left for the example trial) covers the receptive fields of recorded V1 neurons. After another 700 ms, the color of the fixation point changes, cuing the monkey to which of the images it needs to focus its attention. In the following 800 ms, one of the images is rotated, and the monkey is asked to respond if the cued stimulus changes and to withhold responses to changes of the noncued stimulus. MUA is recorded on multiple channels and spiking activity is obtained (raster plots). After an initial transient following stimulus onset (peaks in the channel-averaged activity; top trace), a sustained but weaker activity follows. Analysis of spiking activity was constrained to this segment of 400 ms (gray shading). Mean firing rate of recorded channels in the presented trial (Left raster plot) and average across trials (Right side raster plot) display specificity to stimulus. Ordering of the channels was established based on the trial-average responses to the first image (Top Right raster). (B) Dissimilarity of patterns in average firing rates calculated either across subsets of trials using the same stimulus (within stimulus) or to different stimuli (across stimuli). *P < 0.05, **P < 0.01, ***P < 0.001; n.s., P ≥ 0.05 in this and all subsequent figures.

