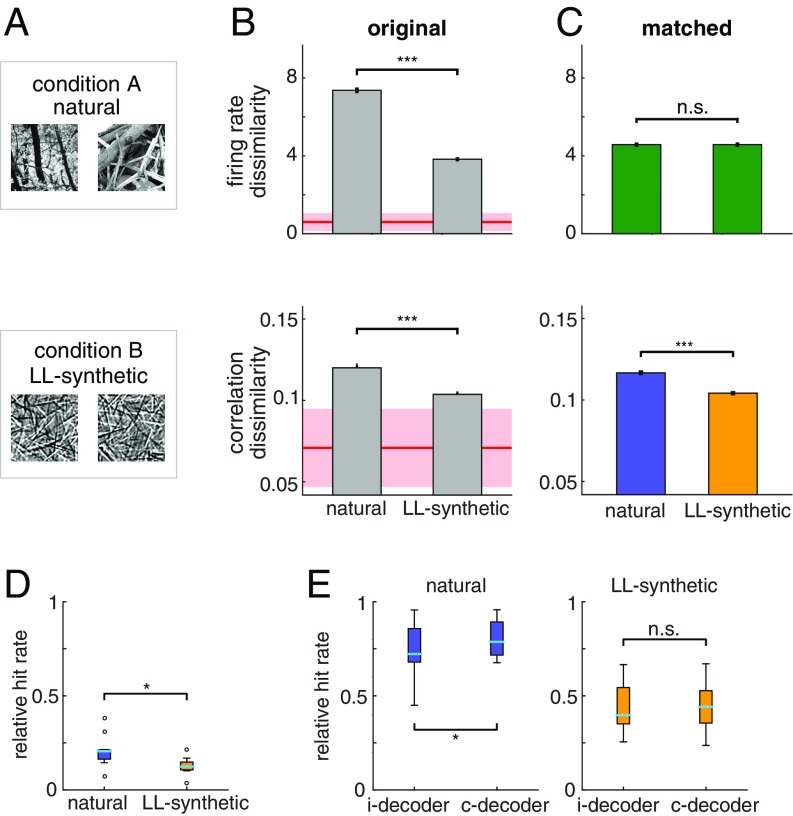
Fig. 5.
Comparison of stimulus specificity of correlation patterns induced by different stimulus structures. (A) Natural image patches and synthetic image patches generated from a V1 model of images (LL-synthetic) used in the experiments. (B) Stimulus specificity of firing rate responses (Top) and SCC patterns (Bottom) in the original (unmatched) data for natural and LL-synthetic images. While correlations show higher specificity for natural images, specificity of firing rate responses is also higher in the reference condition. Shaded areas show the extrapolated estimate of within-stimulus dissimilarity for both firing rates and correlations (SI Appendix). Note that the baseline for correlation dissimilarity is set to the mean of the extrapolated within-stimulus baseline minus 1SD. (C) CRM eliminates stimulus specificity of firing rate responses, but the residual dissimilarity of SCCs is still significantly higher for natural images than for LL-synthetic stimuli. Baseline for correlation dissimilarity as in B. (D and E) Decoding stimulus information from neuron population responses. (D) Performance of a decoder that learns about the correlation structure of the data using a z-scored version of the data. Z-scoring removes mean and variance information from the data leaving the correlations intact. The performance is calculated relative to the chance level (0 means chance performance, 1 means perfect performance). The decoder performs better than chance for the natural and LL-synthetic datasets but shows higher performance for natural stimuli. (E) Relative performance of the c-decoder and i-decoder on the original data for natural (Left) and LL-synthetic (Right) stimuli. The c-decoder performs better than the i-decoder for natural stimuli but not for synthetic stimuli.

