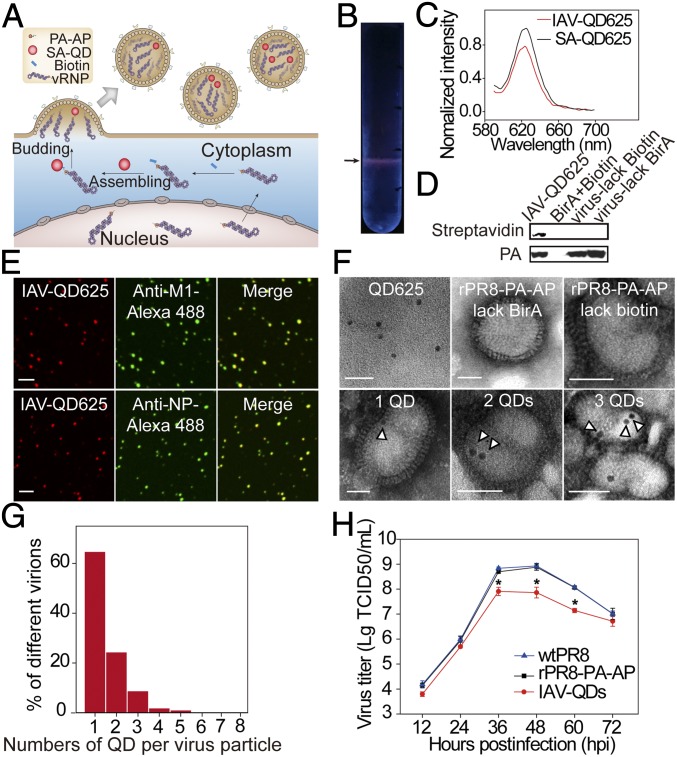
Fig. 1.
Construction and characterization of IAV-QDs. (A) Schematic of construction of IAV-QDs. (B) A representative SDGC tube. Arrow indicates IAV-QD625 band. (C) Fluorescence spectra of IAV-QDs. (D) Western blot analysis of IAV-QD625 using HRP-SA and anti-PA antibody. (E) Immunofluorescence assay of IAV-QD625 using anti-M1 or anti-NP antibody on coverslips. (Scale bar: 2 µm.) (F) TEM images. (Scale bar: 50 nm.) The hollow arrowheads indicate QD625. (G) The percentage of QD numbers per virus particle. (H) Multiple-cycle growth curves of WT PR8 (wtPR8), rPR8-PA–AP, and IAV-QD625 on MDCK cells; n = 3 (*P < 0.05). TCID50, 50% tissue culture infectious dose.

