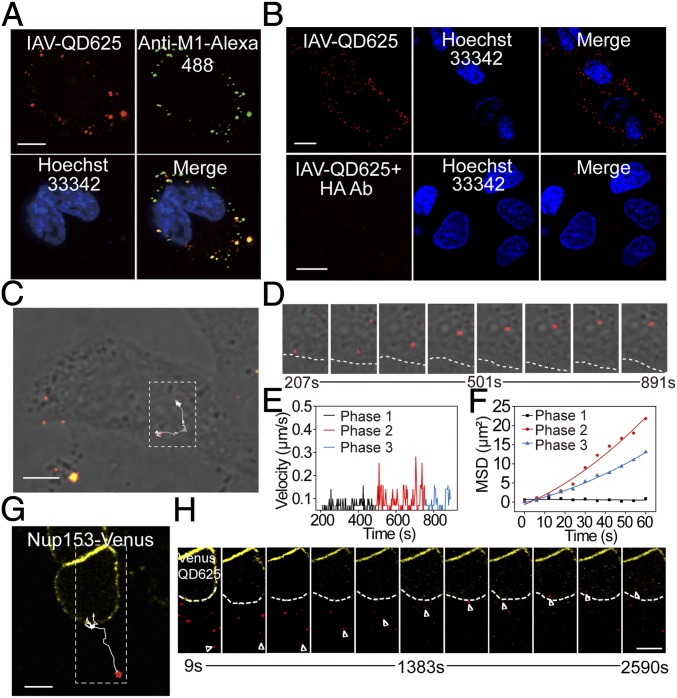
Fig. 2.
Real-time tracking analysis of IAV-QD infection. (A) Immunofluorescence assay of IAV-QD625 attachment on MDCK cells. (B) Images of MDCK cells infected with IAV-QD625 or IAV-QD625 that were neutralized by anti-HA antibody. (C) Image showing the trajectory of an IAV-QD625 virion in cytoplasm. (D) Sequential images of the amplified rectangular region in C. The cellular boundary is highlighted by a dashed line. (E) Analysis of mean velocities of IAV-QD625 in C. (F) MSD plots of IAV-QD625 in C. (G) Image showing the trajectory of an individual IAV-QD625 virion from the cytoplasm to the nucleus. The nuclear membrane is highlighted by Nup153-Venus. (H) Snapshots of real-time tracking of IAV-QD625 in G. Images were taken at 60× magnification objective lens under a confocal microscope. (Scale bar: A–C and G, 10 µm; H, 10 µm.)

