Fig. 3.
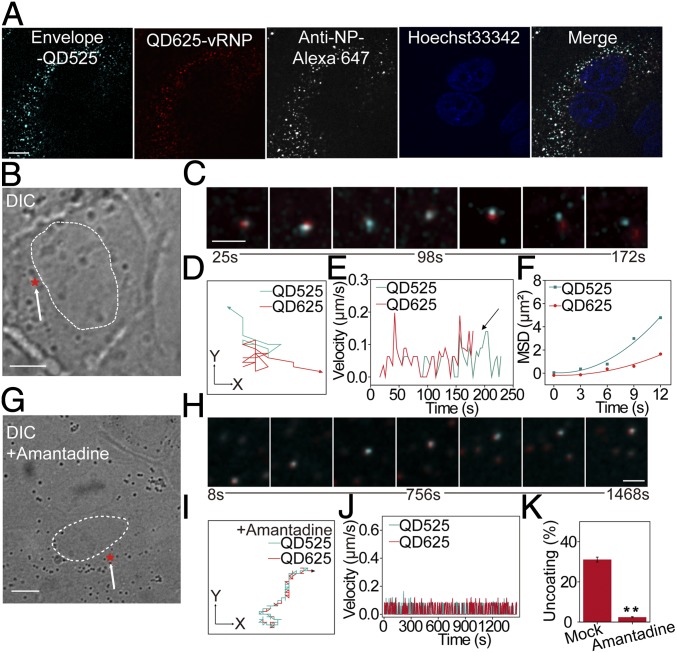
Dual-color visualization of IAV uncoating in live cells. (A) MDCK cells with dual-color IAVs (encapsulating QD625 and decorated with QD525 on surface) and immunostained with anti-NP antibody. (Scale bar: 5 µm.) (B) Differential interference contrast (DIC) image of an infected cell. The nucleus boundary is highlighted by a dashed line, and the arrow marks the uncoating site (red star). (Scale bar: 10 µm.) (C) Snapshots of the separation of QD625-vRNP (red) and QD525-viral envelope (cyan). (Scale bar: 2 µm.) (D) Trajectories of the two QD fluorescent dots in C. (E) Analysis of the mean velocities of these two fluorescent dots. The arrow marks the significant difference in the velocities during separation. (F) MSD plots of these two fluorescent dots. (G) DIC image of an infected cell treated with amantadine. The nucleus boundary is highlighted by a dashed line, and the arrow marks the initiation site (red star). (Scale bar: 10 µm.) (H) Snapshots of the virus shown in G. (Scale bar: 2 µm.) Trajectories (I) and the mean velocities (J) of the colocalized fluorescent dots from H. (K) Analysis of the effect of amantadine treatment on IAV uncoating. A total of 1,055 trajectories in drug-treated cells and 1,160 trajectories in untreated cells were analyzed. **P < 0.01.

