Fig. 7.
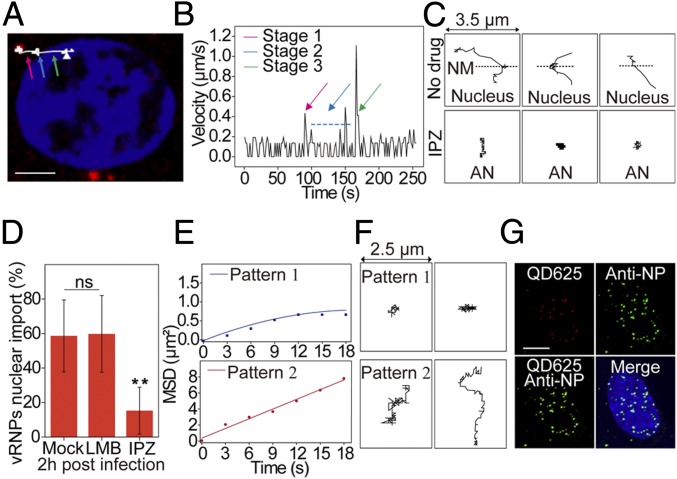
Characterization of vRNP nuclear import and intranuclear movement. (A) Trajectory of a representative QD625-vRNP transport from the AN region to the nucleus. The colored arrows indicate stage 1 (pink), stage 2 (blue), and stage 3 (green). (Scale bar: 5 µm.) (B) Analysis of the mean velocities of QD625-labeled vRNPs shown in A. (C) Trajectories of the QD signals in untreated and importazole (IPZ)-treated cells. NM, nuclear membrane. (D) Statistical analysis of IAV vRNP nuclear import with drug treatment. ns, no significant difference; n = 3; **P < 0.01. (E) Analysis of the MSD plots of two vRNP diffusive patterns in the nucleus. (F) Trajectories of two vRNP diffusive patterns. (G) Immunofluorescence assay of QD625-vRNPs in the nucleus at 2 hpi. (Scale bar: 5 µm.)

