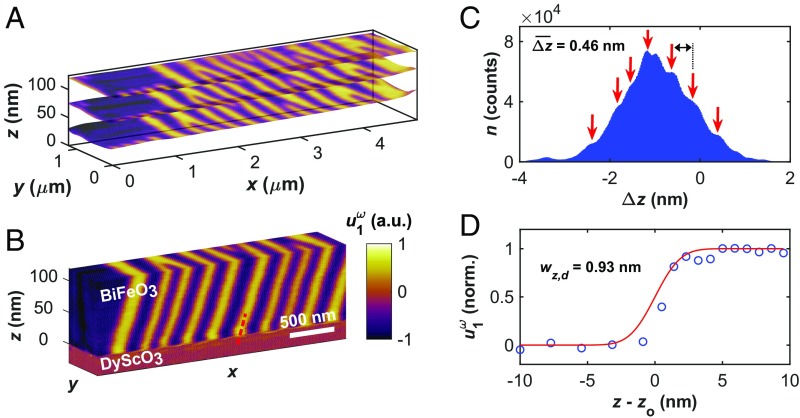
Fig. 2.
Tomographic reconstruction of ferroelectricity from a BiFeO3 thin-film heterostructure. Simultaneously acquired (A) PFM piezoresponse at h = 120 nm, h = 77.8 nm, and h = 33.8 nm from the ∼200-frame tomographic sequence superimposed onto the local surface topography (z position) for each imaging pixel. (B) Three-dimensional tomographic reconstruction of the thickness-resolved piezoresponse from a subregion of A (z dimension magnified ∼15× for viewing). (C) Histogram of the frame-to-frame change in the z position of the BiFeO3 film surface (Δz), calculated on a per-pixel basis. Red arrows indicate apparent unit-cell steps in the fine structure of the histogram. (D) z resolution of tomographic PFM data calculated using the piezoresponse across the BiFeO3/SrRuO3 interface. The red line is an error function fit of the piezoresponse data (blue circles) centered around the interface, zo.

