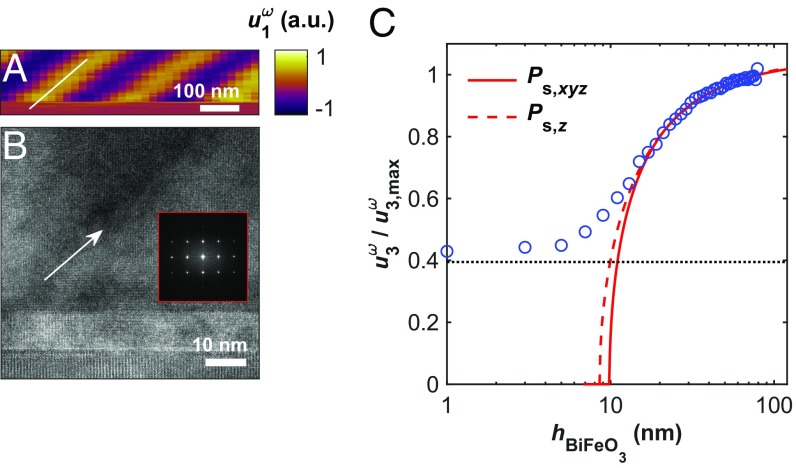
Fig. 3.
Validation of TAFM using high-resolution TEM and phenomenological theory. (A) x-z cross-section of tomographic PFM data depicting the true geometry of a 71° ferroelastic domain wall. (B) Cross-sectional TEM of BiFeO3 showing an equivalent 71° domain wall with identical geometry, obtained below a TAFM processed surface. (Inset) The 2D fast Fourier transform from BiFeO3 adjacent to the domain wall. (C) Semilogarithmic plot of normalized piezoelectric displacement as a function of thickness for BiFeO3, with nonlinear regressions for 3D and one-dimensional LGD phenomenological models. Horizontal dashed line in C indicates the PFM signal noise floor.

