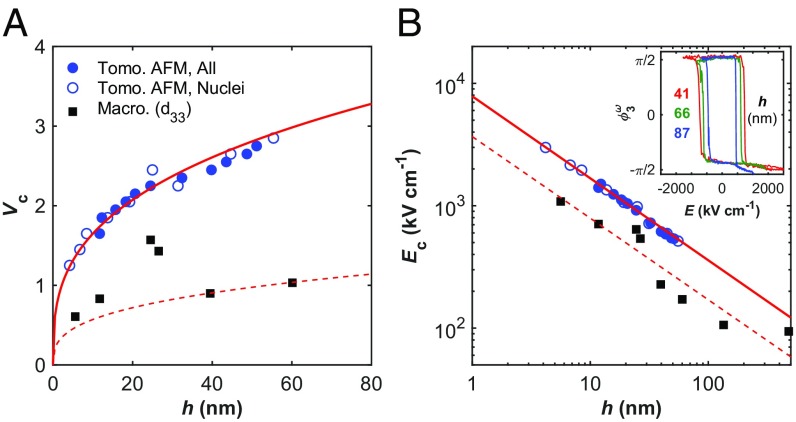
Fig. 5.
Thickness dependence of the coercive voltage (Vc) and coercive field (Ec) in BiFeO3. (A) Vc vs. h, with TAFM data from all switched areas (closed blue circles), domain nuclei (open blue circles), and d33-based measurements on macroscopic capacitor structures (black squares). Solid red line is a nonlinear power-law regression of Vc vs. h. (B) Logarithmic plot of Ec vs. h, using the same labeling convention as A. (Inset) Spectroscopic piezoresponse hysteresis loops (PFM phase) obtained at three discrete thicknesses following TAFM.

