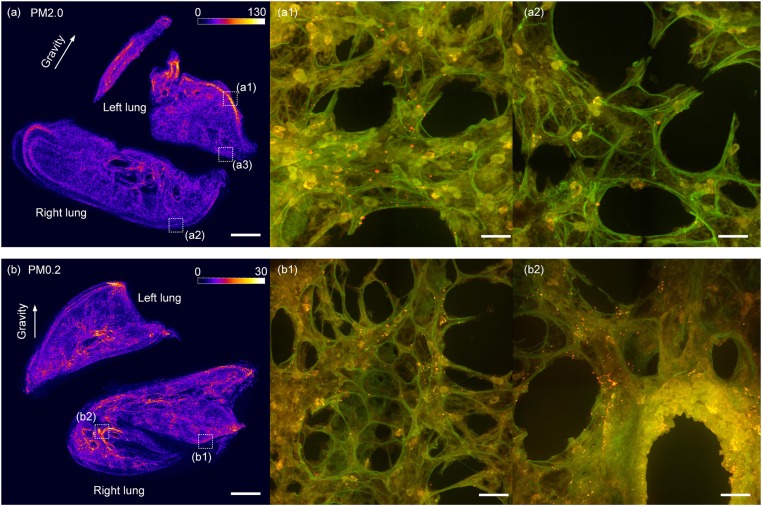
Fig. 1.
The fluorescent deposition patterns of PM2.0 and PM0.2 particles in lungs. A and B are the deposition patterns of PM2.0 and PM0.2 in a mouse lung by the fluorescent intensity, respectively. A1 and A2 show the high and low concentrations of PM2.0 particles in two local areas at the left and right edges, respectively, of a mouse lung. (B) A more uniform deposition pattern of PM0.2 in the lung with equivalent fluorescent intensity on the left and right edges of the lung. (B1) There are still a lot of PM0.2 particles in a local acinar area at the right edge of the right lung. (B2) More PM0.2 particles deposit in the bronchiole region. The red and the orange dots in A1, A2, B1, and B2 are fluorescent PM2.0 particles. (The scale bars in A and B are 1 mm, while in the other four images are 20 μm.)

